This Time Seems Very, Very Different
(Part 2 of Not with a Bang but a Whimper - A Thought Experiment)
by Jeremy Grantham, GMO LLC
Oh, the good old days!
When I started following the market in 1965 I could look back at what we might call the Ben Graham training period of 1935-1965. He noticed financial relationships and came to the conclusion that for patient investors the important ratios always went back to their old trends. He unsurprisingly preferred larger safety margins to smaller ones and, most importantly, more assets per dollar of stock price to fewer because he believed margins would tend to mean revert and make underperforming assets more valuable.
You do not have to be an especially frugal Yorkshireman to think, “What’s not to like about that?” So in my training period I adopted the same biases. And they worked! For the next 10 years, the out-of-favor cheap dogs beat the market as their low margins recovered. And the next 10 years, and the next!1 Not exactly shooting fish in a barrel, but close. Similarly, a group of stocks or even the whole market would shoot up from time to time, but eventually – inconveniently, sometimes a couple of painful years longer than expected – they would come down. Crushed margins would in general recover, and for value managers the world was, for the most part, convenient, and even easy for decades. And then it changed.
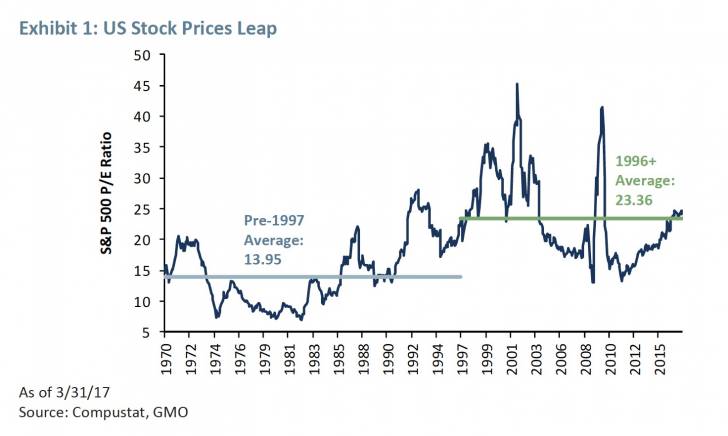
Exhibit 1 shows what happened to the average P/E ratio of the S&P 500 after 1996. For a long and painful 20 years – for someone betting on a steady, unchanging world order – the P/E ratio stayed high by 1935-1995 standards. It still oscillated the same as before, but was now around a much higher mean, 65% to 70% higher! This is not a trivial difference to investors, and 20 years is long enough to test the apocryphal but suitable Keynesian quote that the market can stay irrational longer than the investor can stay solvent.
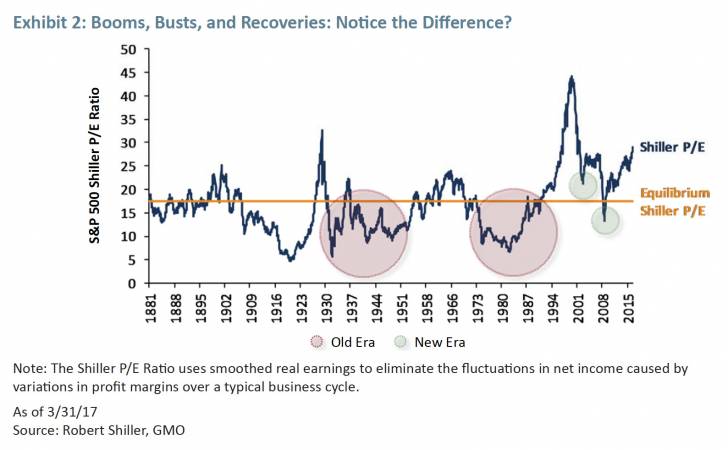
Along the way there were early signs that things had changed. First was the decline from the greatest bubble in US equity history, the 2000 tech bubble. Compared to the previous high of 21x earnings at the 1929 bubble high, this 2000 market shot up to 35x and when it finally broke, it fell only for a second to touch the old normal price trend. And then it quite quickly doubled. Compare that experience to the classic bubbles breaking in the US in 1929 and 1972 (Exhibit 2) or Japan in 1989. All three crashed through the existing trend and stayed below for an investment generation, waiting for a new crop of more hopeful investors. The market stayed below trend from 1930 to 1956 and again from 1973 to 1987. And in Japan, the market stayed below trend for… you tell me. It is 28 years and counting! Indeed, a trend is by definition a level below which half the time is spent. Almost all the time spent below trend in the US was following the breaking of the two previous bubbles of 1929 and 1972. After the bursting of the tech bubble, the failure of the market in 2002 to go below trend even for a minute should have whispered that something was different. Although I noted the point at the time, I missed the full significance. Even in 2009, with the whole commercial world wobbling, the market went below trend for only six months. So, we have actually spent all of six months cumulatively below trend in the last 25 years! The behavior of the S&P 500 in 2002 might have been whispering in my ear, but surely this is now a shout? The market has been acting as if it is oscillating normally enough but around a much higher average P/E.
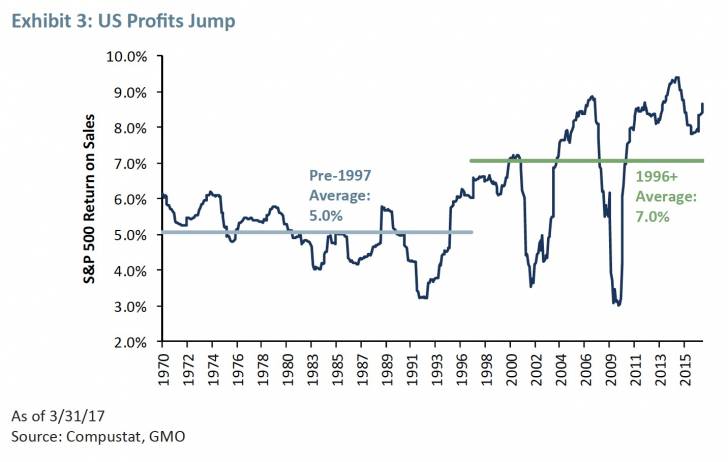
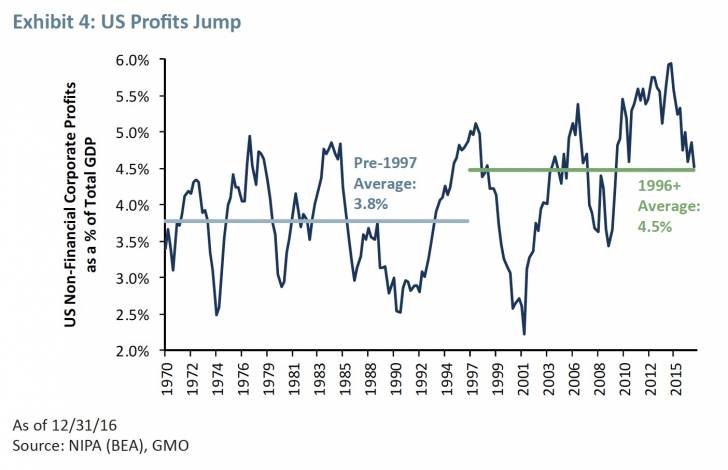
How about profit margins, the other input into the market level? Exhibit 3 shows the return on sales of the S&P 500 and Exhibit 4 shows the share of GDP held by corporate profits. Compared to the pre-1997 era, the margins have risen by about 30%. This is a large and sustained change. And remember, it is double counting: above-average profit margins times above-average multiples will give you very much above-average price to book ratios or price to replacement cost. Counterintuitively, if we need to sell at replacement cost (most people’s view of fair value), then above-normal margins must be multiplied by a below-average P/E ratio and vice versa.
To this point, we have looked at two of the three most important inputs in markets and they are very different in the same direction, upwards. A third one – interest rates – is also very different. As is well-known, short rates have never been at such low levels in history as they were last year. Come to think of it, the population growth rate is also very, very different. As is the aging profile of our population. And the degree of income inequality. So too the extent of globalization and indicators of monopoly in the US. Also the extended period of below-trend GDP growth and productivity almost everywhere but particularly in the developed world. And serious climate change issues that may be understated in countries like the US, the UK, and Australia, where the fossil fuel industries are powerful and engage in effective obfuscation, but pre-1997 the topic was not broadly appreciated at all. The price of oil in 1997 was more or less on its 80-year trend in real terms of around $18 a barrel in today’s currency. The trend price today, based on the cost of finding new oil, is about $65 a barrel with today’s price only slightly lower despite an unexpected surge in supply from US tight oil, or fracking. Three and a half times the old price is not an insignificant change when you realize that almost all serious economic declines have been associated with price surges in oil. And, finally, my old bugbear – the modus operandi of the Federal Reserve and its allies is very different in its 22-year persistent effort to work the highs and lows of the rate cycle lower and lower. One might ask here: Is there anything that really matters in investing that is not different? (Actually, I have one, but will save it for another discussion: human behavior.)
We value investors have bored momentum investors for decades by trotting out the axiom that the four most dangerous words are, “This time is different.”2 For 2017 I would like, however, to add to this warning: Conversely, it can be very dangerous indeed to assume that things are never different.
Corporate profitability is the key difference in higher pricing
Of all these many differences, the most important for understanding the stock market is, in my opinion, the much higher level of corporate profits. With higher margins, of course the market is going to sell at higher prices.3 So how permanent are these higher margins? I used to call profit margins the most dependably mean-reverting series in finance. And they were through 1997. So why did they stop mean reverting around the old trend? Or alternatively, why did they appear to jump to a much higher trend level of profits? It is unreasonable to expect to return to the old price trends – however measured – as long as profits stay at these higher levels.
So, what will it take to get corporate margins down in the US? Not to a temporary low, but to a level where they fluctuate, more or less permanently, around the earlier, lower average? Here are some of the influences on margins (in thinking about them, consider not only the possibilities for change back to the old conditions, but also the likely speed of such change):
• Increased globalization has no doubt increased the value of brands, and the US has much more than its fair share of both the old established brands of the Coca-Cola and J&J variety and the new ones like Apple, Amazon, and Facebook. Even much more modest domestic brands – wakeboard distributors would be a suitable example – have allowed for returns on required capital to handsomely improve by moving the capital-intensive production to China and retaining only the brand management in the US. Impeding global trade today would decrease the advantages that have accrued to US corporations, but we can readily agree that any setback would be slow and reluctant, capitalism being what it is, compared to the steady gains of the last 20 years (particularly noticeable after China joined the WTO).
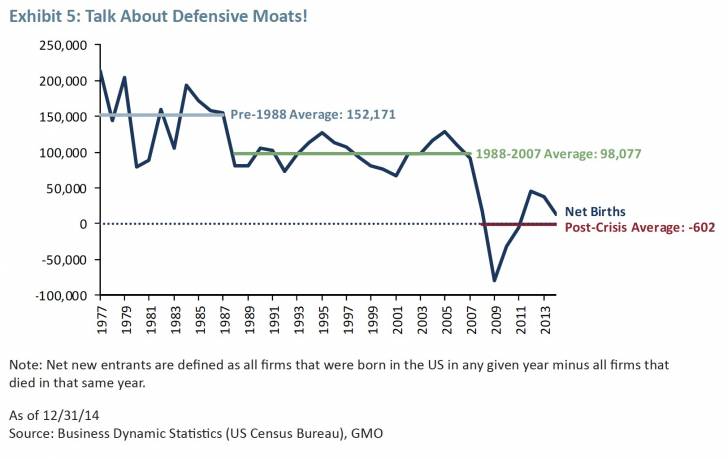
• Steadily increasing corporate power over the last 40 years has been, I think it’s fair to say, the defining feature of the US government and politics in general. This has probably been a slight but growing negative for GDP growth and job creation, but has been good for corporate profit margins. And not evenly so, but skewed toward the larger and more politically savvy corporations. So that as new regulations proliferated, they tended to protect the large, established companies and hinder new entrants. Exhibit 5 shows the steady drop of net new entrants into the US business world – they have plummeted since 1970! Increased regulations cost all corporations money, but the very large can better afford to deal with them. Thus regulations, however necessary to the well-being of ordinary people, are in aggregate anti-competitive. They form a protective moat for large, established firms. This produces the irony that the current ripping out of regulations willy-nilly will of course reduce short-term corporate costs and increase profits in the near future (other things being equal), but for the longer run, the corporate establishment’s enthusiasm for less regulation is misguided: Stripping out regulations is working to fill in its protective moat.
• Corporate power, however, really hinges on other things, especially the ease with which money can influence policy. In this, management was blessed by the Supreme Court, whose majority in the Citizens United decision put the seal of approval on corporate privilege and power over ordinary people. Maybe corporate power will weaken one day if it stimulates a broad pushback from the general public as Schumpeter predicted. But will it be quick enough to drag corporate margins back toward normal in the next 10 or 15 years? I suggest you don’t hold your breath.
• It is hard to know if the lack of action from the Justice Department is related to the increased political power of corporations, but its increased inertia is clearly evident. There seems to be no reason to expect this to change in a hurry.
• Previously, margins in what appeared to be very healthy economies were competed down to a remarkably stable return – economists used to be amazed by this stability – driven by waves of capital spending just as industry peak profits appeared. But now
in a very different world to that described in Part 1,4 there is plenty of excess capacity
and a reduced emphasis on growth relative to profitability. Consequently, there has been a slight decline in capital spending as a percentage of GDP. No speedy joy to be expected here.
• The general pattern described so far is entirely compatible with increased monopoly power for US corporations. Put this way, if they had materially more monopoly power, we would expect to see exactly what we do see: higher profit margins; increased reluctance to expand capacity; slight reductions in GDP growth and productivity; pressure on wages, unions, and labor negotiations; and fewer new entrants into the corporate world and a declining number of increasingly large corporations. And because these factors affect the US more than other developed countries, US margins should be higher than theirs. It is a global system and we out-brand them for one thing.
• The single largest input to higher margins, though, is likely to be the existence of much lower real interest rates since 1997 combined with higher leverage. Pre-1997 real rates averaged 200 bps higher than now and leverage was 25% lower. At the old average rate and leverage, profit margins on the S&P 500 would drop back 80% of the way to their previous much lower pre-1997 average, leaving them a mere 6% higher. (Turning up the rate dial just another 0.5% with a further modest reduction in leverage would push them to complete the round trip back to the old normal.)
This neat outcome tempted me to say, “well that’s it then, these new higher margins are simply and exclusively the outcome of lower rates and higher leverage,” leaving only the remaining 20% of increased margins to be explained by our almost embarrassingly large number of other very plausible reasons for higher margins such as monopoly and increased corporate power. But then I realized that there is a conundrum: In a world of reasonable competitiveness, higher margins from long-term lower rates should have been competed away. (Corporate risk had not materially changed, for interest coverage was unchanged and rate volatility was fine.) But they were not, and I believe it was precisely these other factors – increased monopoly, political, and brand power – that had created this new stickiness in profits that allowed these new higher margin levels to be sustained for so long.
So, to summarize, stock prices are held up by abnormal profit margins, which in turn are produced mainly by lower real rates, the benefits of which are not competed away because of increased monopoly power, etc. What, we might ask, will it take to break this chain? Any answer, I think, must start with an increase in real rates. Last fall, a hundred other commentators and I offered many reasons for the lower rates. The problem for explaining or predicting future higher rates is that all the influences on rates seem long term or even very long term. One of the most plausible reasons, for example, is the aging of the populations of the developed world and China, which produces more desperate 50-year-olds saving for retirement and fewer 30-year-olds spending everything they earn or can borrow. This results, on the margin, in a lowered demand for capital and hence lower real rates. We can probably agree that this reason will take a few decades to fade away, not the usual seven-year average regression period for financial ratios.
Any effect of lower population growth rates is likely to take even longer. No one seems sure what is causing lower productivity growth or what role it has in lower rates, but it would take some very unexpected good fortune to have productivity accelerate enough to drive rates upward in the near term. Income inequality that may be helping to keep growth and rates lower will, unfortunately, in my opinion, also take decades to move materially unless we have a very unexpected near revolution in politics.
Perhaps the best bet for higher rate equilibrium in the next few years is a change in the dominant central bank policy of using low rates to stimulate asset prices (which they clearly do) and stimulate growth (which, other than pushing growth back or forward a quarter or so, I believe they do not do). With 20 years of Fed support for this approach and loyal adherents in the ECB and The Banks of England and Japan, changing the policy is unlikely to be quick or easy. It is a deeply entrenched establishment view, or so it seems. President Trump is admittedly a very, very wild card in this game, and he said a few anti-Fed things in the election phase, for whatever that is worth. He also gets to appoint five new members, including the chair, in the next 18 months. But in the end, will a real estate developer with plenty of assets and an apparent interest in being very rich really promote a materially higher-yield policy at the Fed? Possible, but quite improbable, I think.
In short, I think lower rates than those in effect pre-1997 are likely to be with us for years, and the best we can hope for is several of the factors we’ve discussed moving slowly to push real rates higher. In the meantime, while we wait for higher risk-free rates, investors – value mangers included – should brace themselves for continued higher multiples than those of the old days. (Although with a very good chance that multiples will show a very slow decline.) What does this mean for value investing?
What it does not mean is that cheaper is not better. But price to book was never a measure of cheapness. The low price to book ratios reflect the market’s vote as to which companies have the least useful assets. Only if the market gets carried away with pessimism or feels uncomfortable with the career risk of owning companies in temporary trouble will such ratios work. Sometimes they do and sometimes they don’t. A fully-fledged dividend discount model with strong quality adjustments and epic struggles to correct for accounting slippage is ideally what is needed.
Alternatively, any analyst good enough to predict the future, whether for six months or six years, better than the market will win. Unfortunately for us investors, the prediction business is not easy.
The S&P has been selling at a much higher level of P/E for 20 years now and it has not meant that better stock pickers have not won. My personal belief and experience has been, though, that the greatest deviations from fair value occur at more macro levels – countries and asset classes – where career risk is higher than picking one insurance company over another and therefore the inefficiencies and opportunities for outperforming are greater.
What this argument probably does mean is that if you are expecting a quick or explosive market decline in the S&P 500 that will return us to pre-1997 ratios (perhaps because that is the kind of thing that happened in the past), then you should at least be prepared to be frustrated for some considerable further time: until you can feel the process of the real interest rate structure moving back up toward its old level. All in all, from the many possibilities, I prefer my suggestion (from Part 1) of a 20-year limping regression that takes us two-thirds of the way back to the good old days pre-1997. What I fear is that if I am wrong, it is less likely to be because regression is more dramatic as some die-hard value managers believe (and I would dearly, dearly love to see!) than it is to be even slower. (The outlook I proposed for the S&P 500 last October of 2.8% real per year for 20 years – the whimper path – has fallen to 2.3% real at recent higher prices).
Outlook for corporate margins – and hence (probably) the market in 2017
There are three factors moving in favor of US profit margins this year. First, oil and resource prices appeared to have bottomed out last year and seem likely to have favorable comparisons for a few quarters.5 Second, Trump is likely to settle for a moderate reduction in corporate tax rates this year after bouncing off the infinitely complex task of a full redo of the tax code. In a theoretical world, corporate taxes are a pass-through to consumers, but in the current, stickier, more monopolistic, more profit-fixated world, a corporate tax reduction will raise corporate profits for quite a while from where they otherwise would have been. Third, removing regulations here and there will, as mentioned, lower corporate costs in the short term. Net-net, unless there are some substantial unexpected negatives, US corporate margins will be up this year, making for the likelihood, in my opinion, of an up year in the market at least until late in the year. This does seem to make the odds of a major decline in the near future quite low (famous last words?). Next year, though, is a different proposition.
In conclusion, there are two important things to carry in your mind: First, the market now and in the past acts as if it believes the current higher levels of profitability are permanent; and second, a regular bear market of 15% to 20% can always occur for any one of many reasons. What I am interested in here is quite different: a more or less permanent move back to, or at least close to, the pre-1997 trends of profitability, interest rates, and pricing. And for that it seems likely that we will have a longer wait than any value manager would like (including me).
*****
Footnotes:
1 In fact, between 1965 and 1995 cheap price to book stocks (best decile) continuously outperformed the market on a rolling 10-year basis with one exception – 1973 (French and Fama).
2 John Templeton
3 Price to book and price to sales will naturally sell at higher multiples when there are higher margins, but there is no arithmetic reason why P/Es should move up. But they do (to be discussed in an upcoming piece).
4 See the 3Q 2016 GMO Quarterly Letter, available at www.gmo.com.
5 Rising oil prices have a short-term effect of about one year of boosting profits and vice versa because oil company profits quickly respond and the much more thinly-spread benefits do indeed cause profits to move in the opposite direction, but much more slowly.
Jeremy Grantham. Mr. Grantham co-founded GMO in 1977 and is a member of GMO’s Asset Allocation team, serving as the firm’s chief investment strategist. Prior to GMO’s founding, Mr. Grantham was co-founder of Batterymarch Financial Management in 1969 where he recommended commercial indexing in 1971, one of several claims to being first. He began his investment career as an economist with Royal Dutch Shell. He is a member of the GMO Board of Directors and has also served on the investment boards of several non-profit organizations. He earned his undergraduate degree from the University of Sheffield (U.K.) and an MBA from Harvard Business School.

