Technical Talk: An Update on Seasonal Trades – Take Profits on Agriculture and Home Builders
 Printer-friendly Version
« AGRIUM INC (AGU) NYSE – Feb 01, 2013 ~|~ James Paulsen: Investment Commentary (January 30, 2013) »
Tweet
Email This Article

by Don Vialoux, TechTalk
Comments for Friday February 1st
U.S. equity index futures are higher this morning. S&P 500 futures are up 10 points in pre-opening trade. Index futures responded to news that China’s January Purchasing Managers Index slipped from 50.6 to 50.4 but remained above the 50.0 level indicating growth. The Shanghai Composite gained 1.4%.
Index futures moved higher following release of the January employment report. Consensus for January Non-farm Payrolls was 180,000 versus revised December report at 196,000. Actual was 157,000. Consensus for Private Non-farm Payrolls was 193,000 versus revised December report at 202,000. Actual was 166,000. Consensus for the January Unemployment Rate was a decline to 7.7% from 7.8% in December. Actual was an increase to 7.9%. Consensus for January Hourly Earnings was a gain of 0.2% versus an increase of 0.3% in December. Actual was a gain of 0.2%.
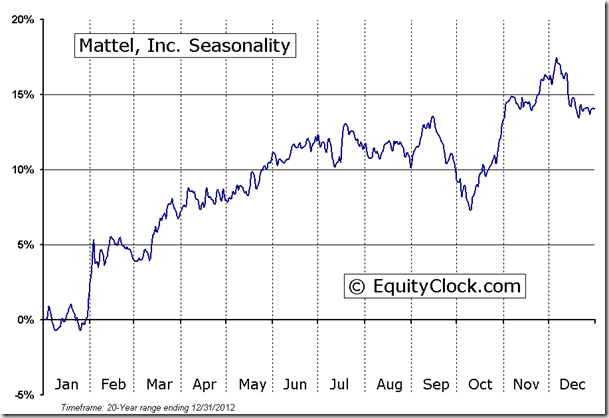
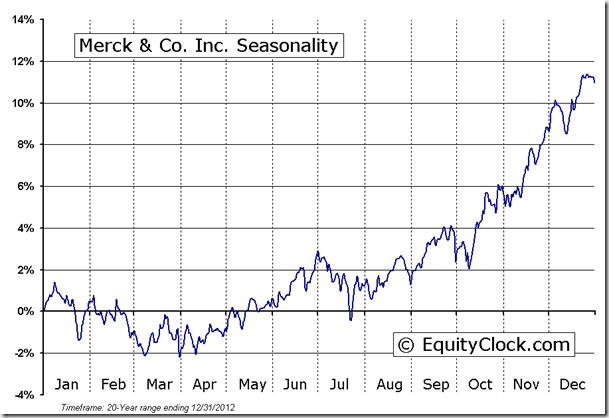
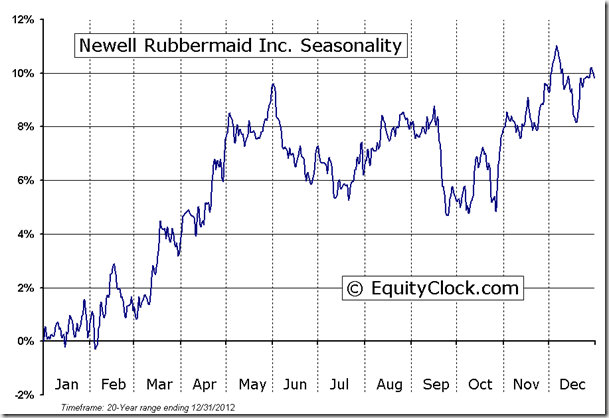
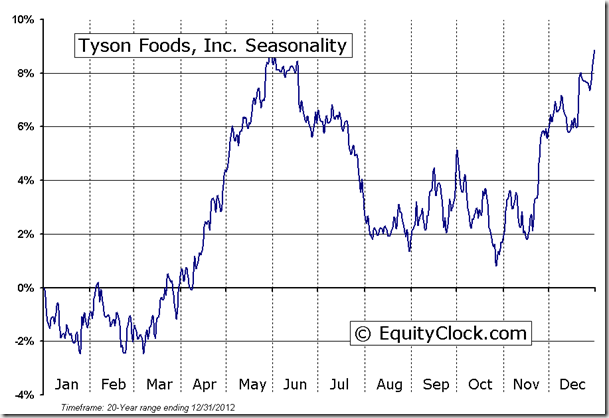
Fourth quarter reports continue to pour in. Companies reporting overnight included Merck, Exxon Mobil, Tyson Foods, Ingersoll-Rand, Newell Rubbermaid, Chevron and Mattel.
Master Card added $1.60 to $520.00 despite a downgrade by Wells Fargo from Outperform to Market Perform.
Oracle improved $0.29 to $35.80 after BMO Capital upgraded the stock from Market Perform to Outperform.
UPS fell $0.35 to $78.94 after Citigroup downgraded the stock from Buy to Neutral.
Verizon gained $0.33 to $43.94 after Piper Jaffray upgraded the stock from Neutral to Overweight.
Constellation Brands added $0.21 to 32.57 despite a downgrade by Goldman Sachs from Buy to Neutral.
Buffalo Chicken Wings gained $0.47 to $74.02 after KeyBanc upgraded the stock from Hold to Buy. ‘Tis the season! 
Don Vialoux on BNN
A discussion why the TSX Composite Index is expected to outperform the Dow Jones Industrial Average and S&P 500 Index between now and the end of the first week in March!
Following is a link to the interview at 4:50 PM yesterday:
http://watch.bnn.ca/#clip855892
Editor’s Note: The last time that the TSX Composite exceeded the Dow Jones Industrial Average was April 2010. From April 2010 to August 2012, the Dow Jones Industrials exceeded the TSX by 1,350 points. Subsequently, the spread narrow (i.e. the TSX outperformed the Dow Jones Industrial Average) to 1,143 as of yesterday. If history repeats, the spread should continue to narrow between now and the end of the first week in March.
Keith Richards’ Blog
I just posted a blog on a seasonal strategy incorporating a low-volatility ETF. Many thanks to BMO ETF’s and Brooke Thackray for their data. Read the results of this strategy at www.smartbounce.ca
Update on Sector Seasonal Trades
Seasonal trades preferably have a technical score of 3 based on (1) uptrend, (2) trading above its 20 day moving average and (3) outperforming the market (S&P 500 for U.S. holdings, TSX for Canadian holding). Scores moving lower than 3 are warning signs. A score of 0-0.5 is a sell signal.
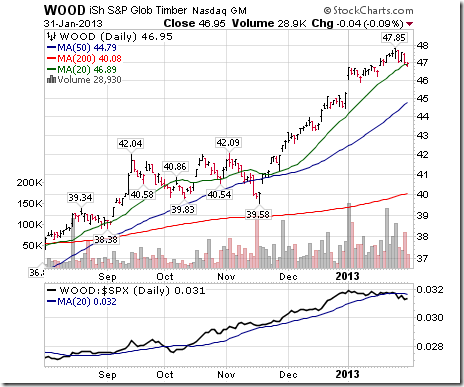
Technical score on the forest product ETF changed from 3 to 2 when strength relative to the S&P 500 turned negative. Technical score is about to drop to 1 on a break below its 20 day MA. Seasonal influences end in mid-February, but can extend to April
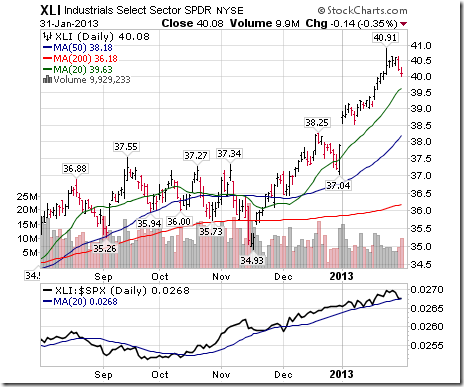
Technical score for the Industrial SPDR remains 3. The Index closed at an all-time high earlier this week. Seasonal influences are positive until early May.
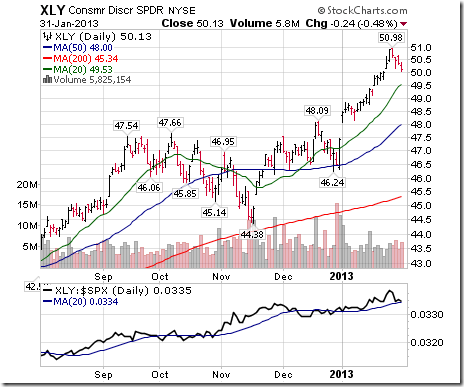
Technical score for the Consumer Discretion SPDR remains 3. The Index closed at an all-time high earlier this week. Seasonal influences are positive until mid-April
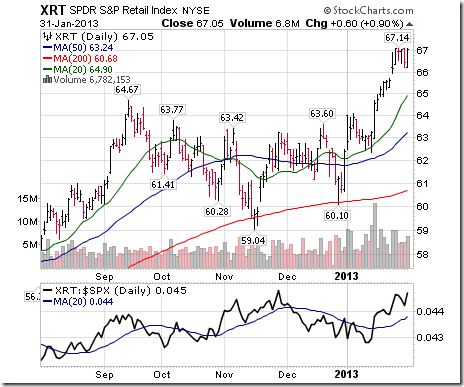
Technical score for the Retail SPDR (a subsector of Consumer Discretionary sector) is 3. Units closed at an all-time closing high yesterday. Seasonal influences are positive until mid-April.
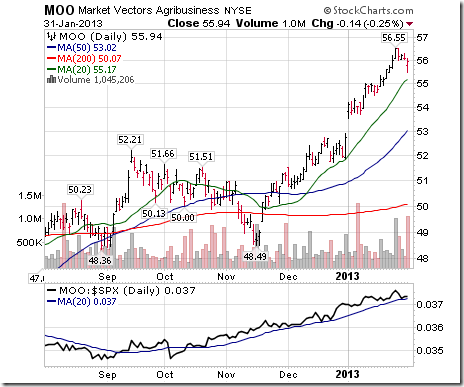
Technical score for the Agriculture ETF changed from 3 to 2 when strength relative to the S&P 500 Index turned negative. Its period of seasonal strength has passed. Take profits.
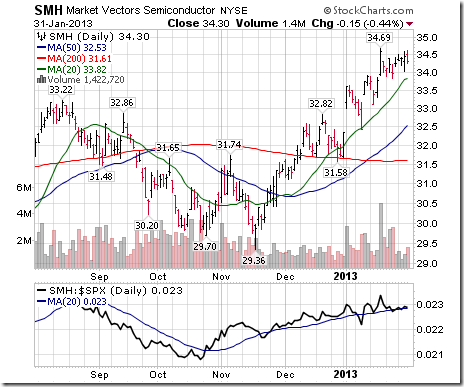
Technical score for the Semiconductor ETF is 3. Seasonal influences are positive until the first week in March.
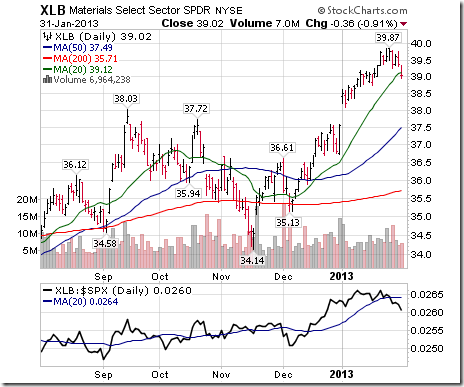
Technical score for the Materials SPDR fell from 3 to 1 when units fell below their 20 day moving average yesterday and showed underperformance relative to the S&P 500 Index. Warning signs have appeared. Seasonal influences turn more positive near the end of February.
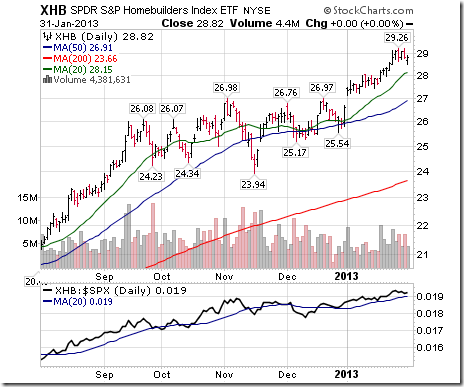
Technical score for the Home Builders ETF is 3, but relative strength shows early signs of under-performance. Seasonal strength ends next week. A drop in technical score is a sell signal.
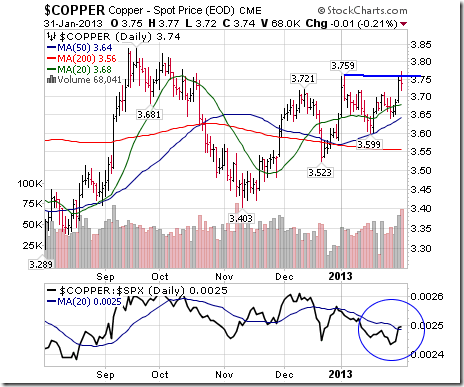
Copper’s technical score increased from 2 to 3 when strength relative to the S&P 500 Index turned positive. Seasonal influences are positive until May.
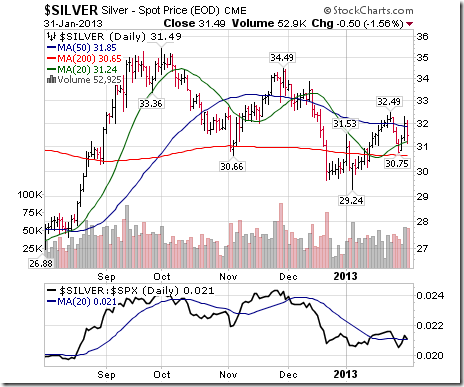
Silver’s technical score is 2.5, down from 3.0 last week. Strength relative to the S&P 500 Index changed from positive to neutral.
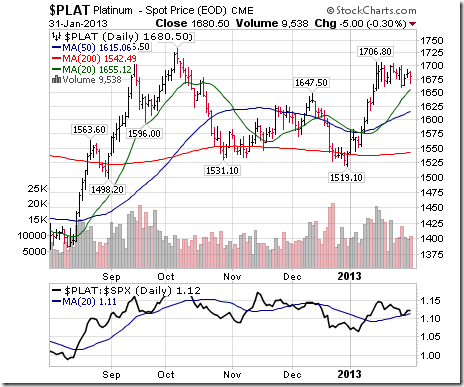
Platinum’s technical score is 3. Seasonal influences are positive until the end of May.
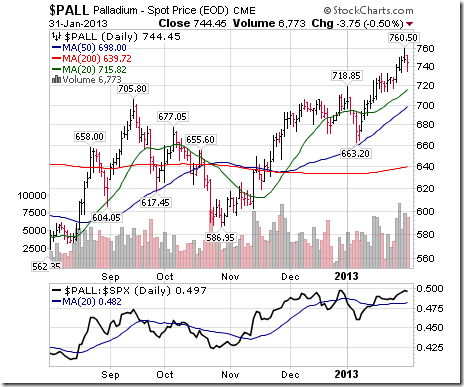
Ditto for Palladium! Technical score is 3. Seasonal influences are positive until the end of May.
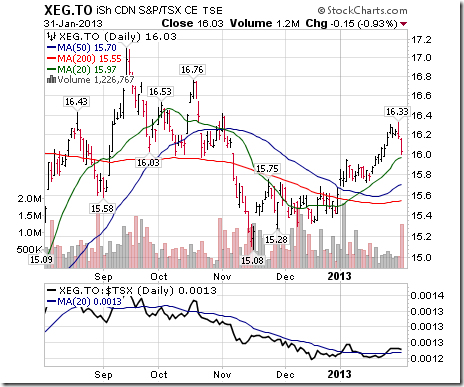
Technical score for the TSX Energy iShares is 3. Seasonal influences are positive until early May with a possible extension to mid-June.
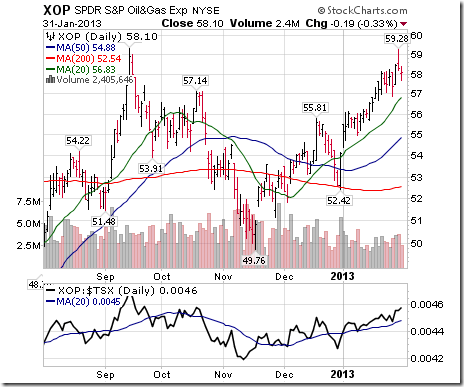
Technical score for the U.S. Oil and Gas Exploration and Development ETF is 3. Units broke to a new high on Wednesday. Seasonal influences are positive until the end of April
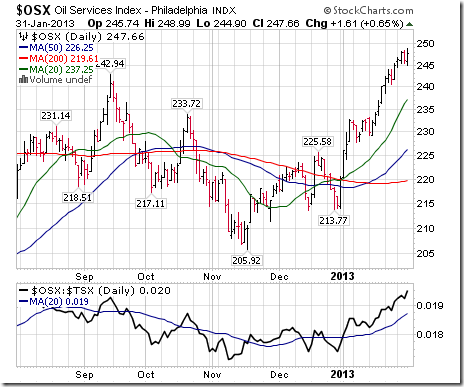
Technical score for the Philadelphia Oil Services Index is 3. Units touched a 12 month high yesterday. Seasonal influences are positive until the end of April.
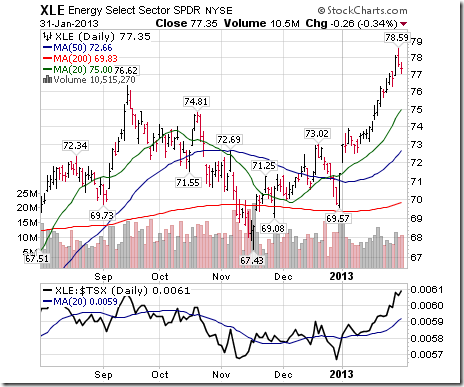
Technical score for the Energy SPDR is 3. Seasonal influences are positive until the end of April.
Thackray’s 2013 Investment Guide
Thackray’s 2013 Investor’s Guide is here. Order through www.alphamountain.com , Amazon, Chapters or Books on Business.
Special Free Services available through www.equityclock.com
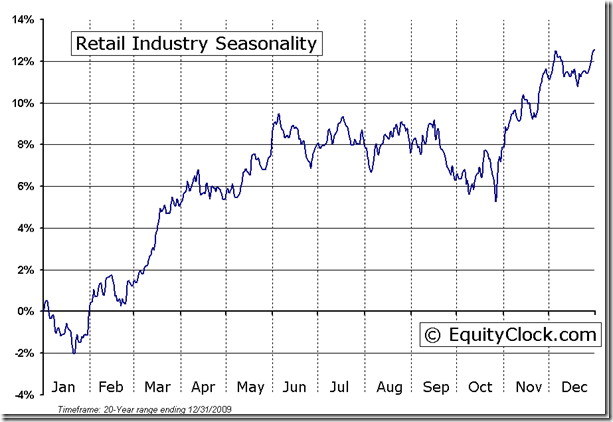
Equityclock.com is offering free access to a data base showing seasonal studies on individual stocks and sectors. The data base holds seasonality studies on over 1000 big and moderate cap securities and indices.
To login, simply go to http://www.equityclock.com/charts/
Following is an example:
Retail Industry Seasonal Chart
FP Trading Desk Headline
FP Trading Desk headline reads, “Earnings have little to do with growing interest in stocks”. Following is a link to the report:
Eric Wheatley’s Listed Options Column
Hello good readers,
In this season of schizophrenic weather (it’s currently 9° out and raining like crazy as I write this. In a much earlier and carefree incarnation of my life, I’d dated ladies who reminded me of my city. Emotional whipsaws are like our winters and after certain outbursts, you can’t believe that you’re dealing with this… stuff; but goshdarnit, you’re quickly reminded of her charms and can’t leave), I guess it’d be relevant to continue our discussion of volatility.
As mentioned last week, the VIX is historically underpriced. It’s not that people aren’t expecting volatile markets, it’s just that yield-hungry investors are massively selling options because they can’t get sufficient returns elsewhere. Two corollaries can be derived from this fact: a) options writers (such as myself with our clients) have to be very attentive to what they are doing. We don’t want to give up too much on the upside without being properly compensated; b) options buyers are probably buying cheap volatilities.
We’ll discuss path-dependency and delta-hedging next week. Here, I’ll just define a couple of low-risk, direction-neutral strategies which could be used by those who wish to have fun and possibly profit from singularly odd market circumstances.
Not to baby this too much, but I do need to start from the beginning: options come in two varieties, calls and puts. Calls give their holder the right to buy shares at a given price, and puts give their holder the right to sell shares at a given price. This means that if you own a call and the underlying stock’s price rises, your call will become more valuable. Conversely, if you own a put, it’ll become more valuable if the stock’s price drops.
The fun thing about options is that you can combine them in any number of weird ways to create funky new positions your parents never dared tell you about. This Mr. Potato Head-like characteristic scares away lots of neophytes; options seem crazy complicated and most people don’t dare touch them. This makes me sad, much like some sort of misunderstood monster banished to the deepest woods by the townsfolk. It was an accident. I just wanted a hug.
Anyhoo, If you think options are underpriced, you would like to buy them, right? Now, you have to decide whether to buy calls or puts. What if you don’t really have a strong opinion on the medium-term direction of the markets? This is where things get fun: you don’t NEED an opinion! You can buy both calls AND puts. Why limit yourself?
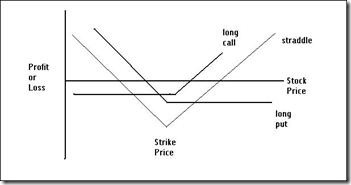
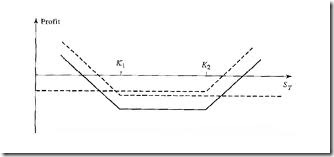
The basic strategy of buying both calls and puts is called either a “straddle” or a “strangle”. There is no beneficial difference between the two; a straddle means that the calls and puts share the same strike price, whereas with a strangle the strike prices are different. Here are some graphs (quickly downloaded off of the web) to illustrate:
This is a straddle:
…and this is a strangle:
(I need to mention, as I always do when I include graphs, that there are NO straight lines in options trading. Ever. This is simply to get the concept across, but the images you see in every options manual are inherently fictitious; though I’m just being fastidious).
As you can see, you are paying money out to buy the options, so if the stock doesn’t move, you’re in the hole for the amount you paid. If the stock moves big in either direction, you can profit.
Given that options prices are relatively cheap, your potential losses are lower. Furthermore, since you’re paying relatively less to set up the position, you need less of a move in the underlying for the trade to be profitable.
Of course, this all sounds great in theory, but in practice you have to pay fees to your broker and the bid-ask spread. I’m never comfortable in discussing multiple-legged transactions for these reasons, so if I may add a little piece of advice: make sure you do this on very liquid options. Liquidity, unfortunately, is a rare thing this side of the 49th parallel, so perhaps it would behoove you to do the trade down below where people like to characterise our country as being their head adornment.
Cheers!
Éric Wheatley, MBA, CIM
Associate Portfolio Manager, J.C. Hood Investment Counsel Inc.
eric@jchood.com
514.604.2829; 1.855.348.2829
*****************
Little known fact about John Charles Hood #59
Ohhhh… straddles? Yeah, this week’s little known fact should be easy to come up with. Sure. I just have to be subtle about it.
…aaaaaannd there’s no way to be subtle.
Seasonality for equity markets and sectors in the month of February
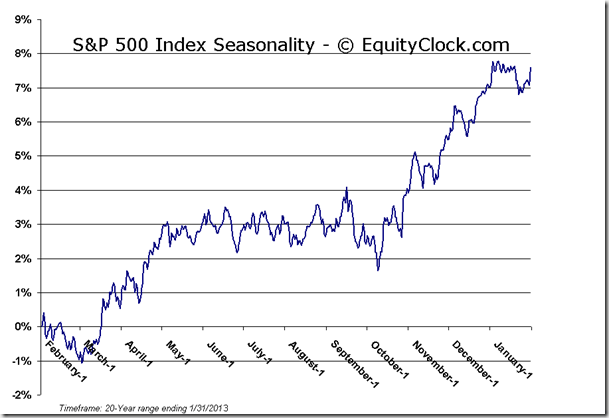
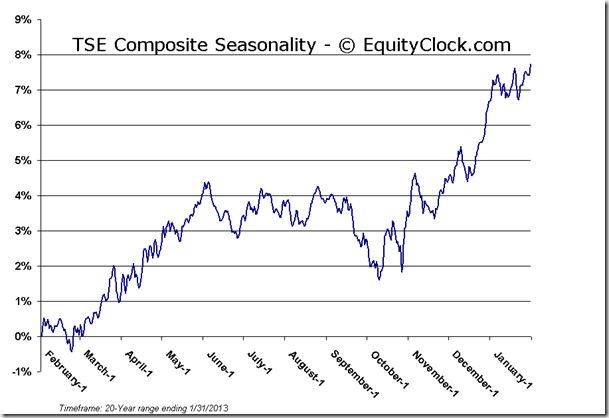
Thackray’s 2013 Investor’s Guide notes that from 1950 to 2011, February was the second worst performing month for the S&P 500 Index. The month also ranked fourth worst for the Dow Jones Industrial Average and the NASDAQ Composite Index. The TSX Composite Index performed much better. February was the fifth best performing month for the TSX Composite with an average return per period since 1985 of 0.9%.
Economically sensitive sectors were the best performers in February during the past 20 periods. Energy was the top performer followed by Materials and Consumer Discretionary. Weakest sectors were Telecom and Utilities. Best performing subsectors were Silver, Metals & Mining, Chemicals and Retail. Worst performing subsectors were Biotech, Pharmaceuticals and Software.
Upcoming US Events for Today:
- Motor Vehicle Sales for January will be released throughout the day. The market expects Total Vehicle Sales to show 15.3M versus 15.4M previous.
- The Employment Situation Report for January will be released at 8:30am. The market expects Non-farm Payrolls to increase by 165K versus 155K previous, while Private Payrolls are expected to increase by 185,000 versus 168,000 previous. The Unemployment Rate is expected to tick lower from 7.8% to 7.7% previous.
- PMI Manufacturing Index for January will be released at 8:58am. The market expects 55.5 versus 54.0 previous.
- Consumer Sentiment for January will be released at 9:55am. The market expects 71.5 versus 71.3 previous.
- The ISM Manufacturing Index for January will be released at 10:00am. The market expects 50.7, consistent with the previous report.
- Construction Spending for December will be released at 10:00am. The market expects an increase of 0.8% versus a decline of 0.3% previous.
Upcoming International Events for Today:
- German PMI Manufacturing for January will be released at 3:55am EST. The market expects 48.8 versus 46.0 previous.
- Euro-Zone PMI Manufacturing for January will be released at 4:00am EST. The market expects 47.5 versus 46.1 previous.
- Great Britain PMI Manufacturing for January will be released at 4:30am EST. The market expects 51.0 versus 51.4 previous.
- Euro-Zone Consumer Price Index Estimate for January will be released at 5:00am EST. The market expects a year-over-year increase of 2.1% versus an increase of 2.2% previous.
- Euro-Zone Unemployment Rate for December will be released at 5:00am EST. The market expects 11.9% versus 11.8% previous.
The Markets
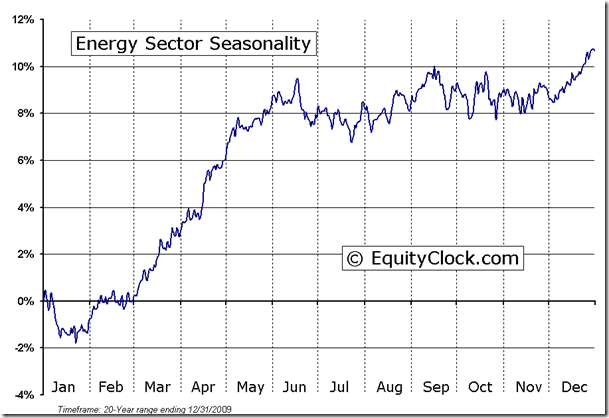
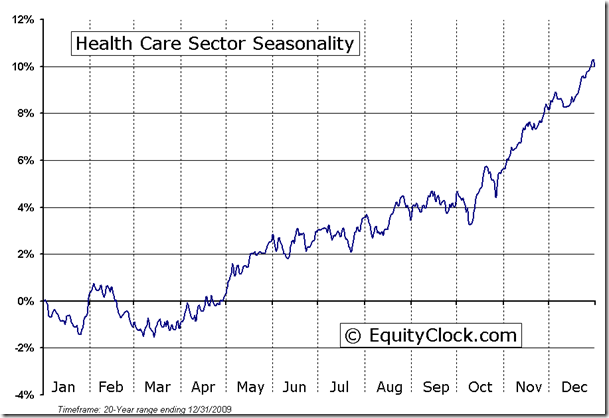
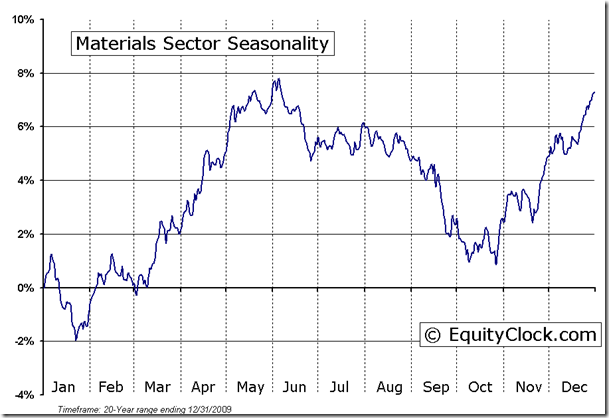
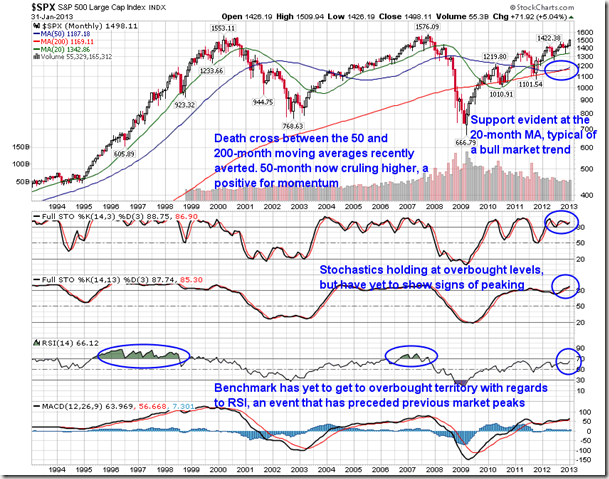
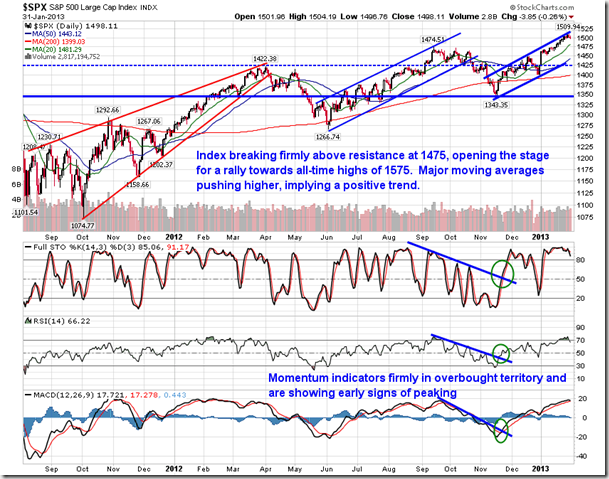
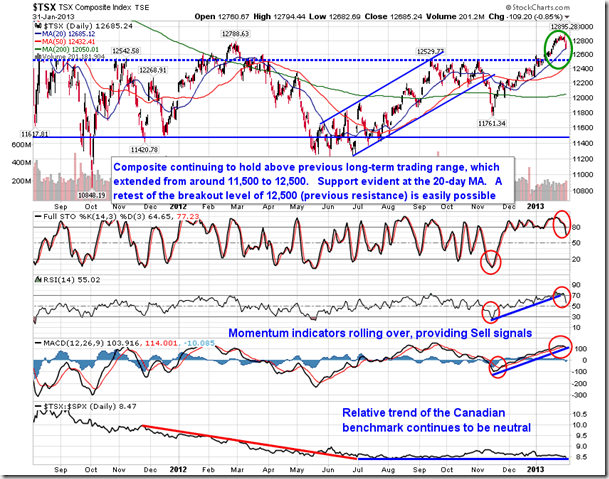
Markets drifted lower on Thursday as investors reallocated portfolios on the last trading day of the month. Gains for January were substantial with the S&P 500 posting a return of 5.04%, the Dow Jones Industrial Average with a return of 5.77%, the NASDAQ with a return of 4.06%, and the TSX Composite with a return of 2.02%. Best performing sectors for this first month of the year were Energy, which gained 8.30%, and Health Care, which gained 7.60%. Energy typically enters a period of seasonal strength in the month of January with positive influences increasing into the month of February as the price of Oil moves higher, on average, between February 25th and May 9th. The strong performance in the Health Care sector in January is not the norm as gains for the month average a flat result. The sector typically weakens into the month of February as investors shed defensive assets in favor of cyclical exposure. Health Care stocks customarily bottom in March and move higher from April through to June as investors once again become defensive around the notorious “Sell in May” date. Technology was the weakest sector in January as the period of seasonal strength came to an end. Energy and Materials are seasonally the best performing sectors in the month of February, each producing average gains topping 1%. The returns for the S&P 500 in this second month of the year have averaged a marginal loss of 0.15%.
Now that January is over, it is worth taking a look at the monthly chart of the S&P 500 Index to get a long-term view of the market. A trend of higher-highs and higher lows remains clearly evident from the March 2009 low, implying that the long-term bull market trend remains intact. Major moving averages are pointed higher supporting the positive move in equities. The 50-month and 200-month moving average initially had appeared on track to chart a bearish crossover, the first ever in the history of the index. However, this gloomy technical event was averted in recent months as the 50-month average curled higher, halting the over 4 years of declines. Support over the last year and a half has become apparent at the 20-month moving average. A change in the long-term trend has typically resulted when the benchmark crosses below this 20-month average. Although stochastics indicate that the market is overbought, momentum sell signals have yet to be generated. The trend of momentum indicators, including RSI and MACD, remain flat to positive, a scenario that is not suggestive of any significant declines in the immediate future. The index has yet to get to overbought territory with regards to RSI (a reading above 70), an event that has preceded previous significant market peaks. Despite any short-term gyrations, the longer-term picture remains quite positive, certainly not suggesting any bearish outcomes in the months ahead.
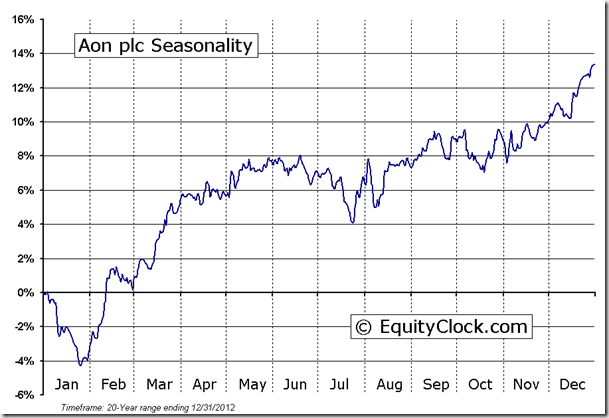
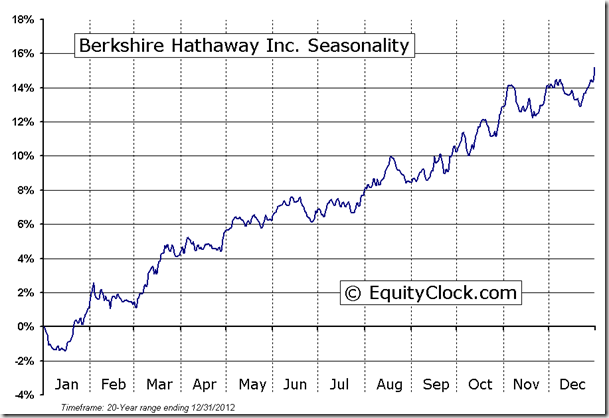
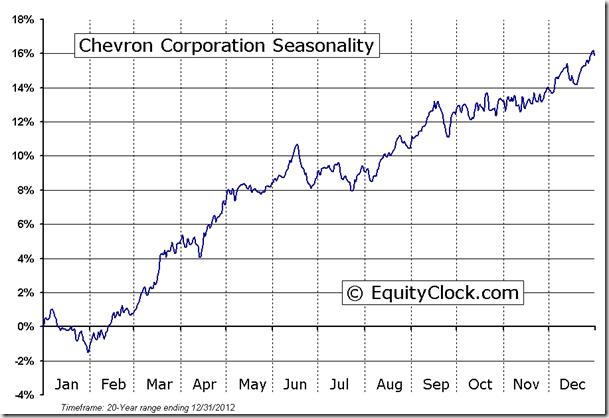
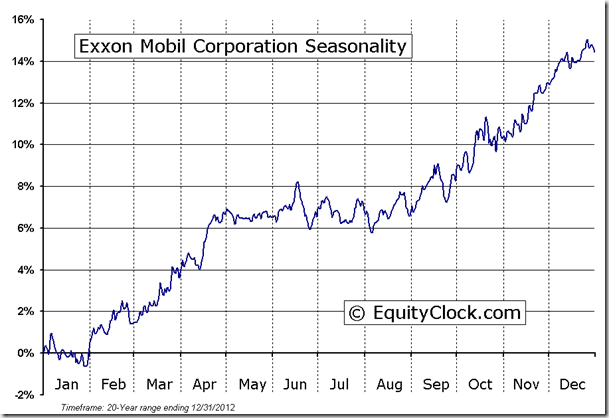
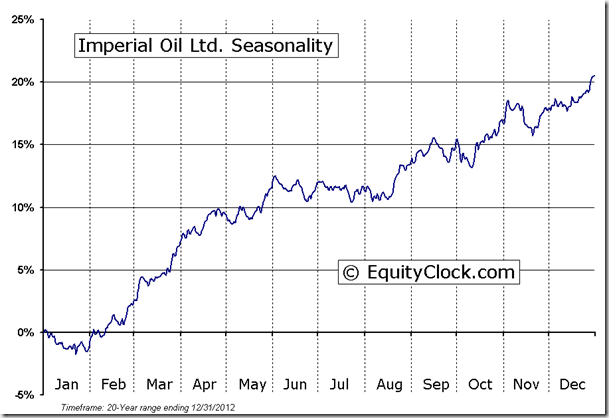
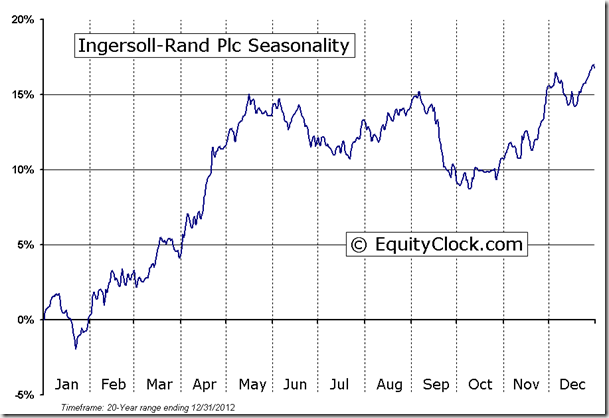
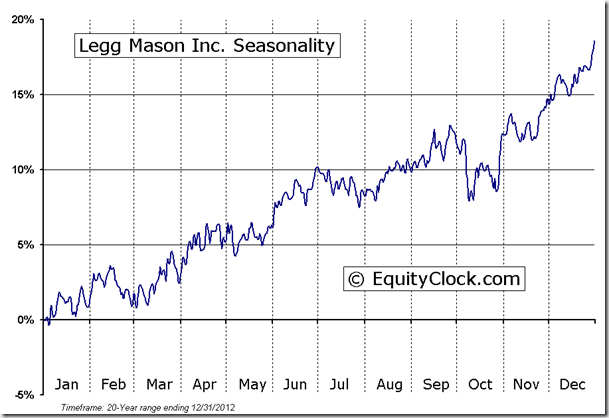
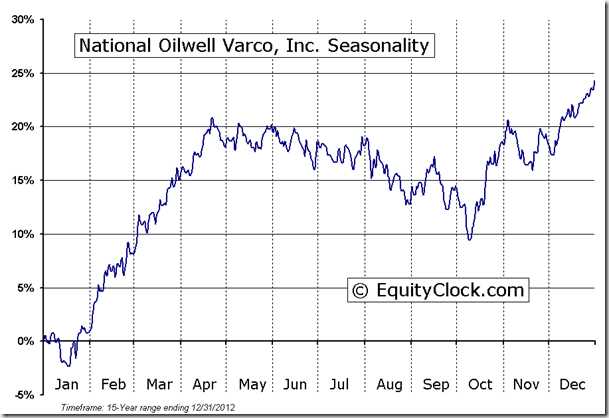
Earnings on tap today include Aon, Berkshire Hathaway, Chevron, Exxon Mobil, Imperial Oil, Ingersoll-Rand, Legg Mason, Mattel, Merck, National Oilwell Varco, Newell Rubbermaid, and Tyson Foods.
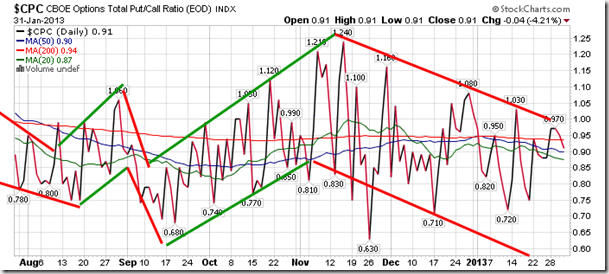
Sentiment on Thursday, as gauged by the put-call ratio, ended bullish at 0.91.
Chart Courtesy of StockCharts.com
Chart Courtesy of StockCharts.com
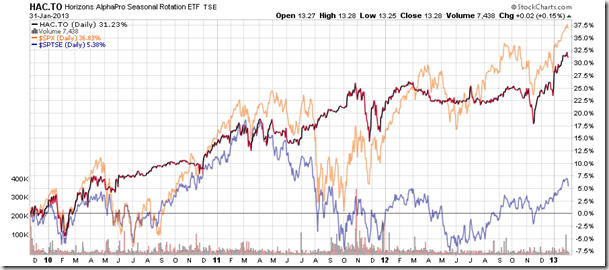
Horizons Seasonal Rotation ETF (TSX:HAC)
- Closing Market Value: $13.28 (up 0.15%)
- Closing NAV/Unit: $13.29 (down 0.08%)
Performance*
| 2013 Year-to-Date | Since Inception (Nov 19, 2009) | |
| HAC.TO | 4.49% | 32.9% |
* performance calculated on Closing NAV/Unit as provided by custodian
Click Here to learn more about the proprietary, seasonal rotation investment strategy developed by research analysts Don Vialoux, Brooke Thackray, and Jon Vialoux.
 Disclaimer: Comments and opinions offered in this report at www.timingthemarket.ca are for information only. They should not be considered as advice to purchase or to sell mentioned securities. Data offered in this report is believed to be accurate, but is not guaranteed.
Don and Jon Vialoux are research analysts for Horizons Investment Management Inc. All of the views expressed herein are the personal views of the authors and are not necessarily the views of Horizons Investment Management Inc., although any of the recommendations found herein may be reflected in positions or transactions in the various client portfolios managed by Horizons Investment Management Inc
Horizons Seasonal Rotation ETF HAC January 31st 2013
Copyright © TechTalk

Latest AdvisorAnalyst Stories
Don Vialoux is the author of free daily reports on equity markets, sectors, commodities and Exchange Traded Funds. He is also a research analyst at Horizons Investment Management, offering research on Horizons Seasonal Rotation ETF (HAC-T). All of the views expressed herein are his personal views although they may be reflected in positions or transactions in the various client portfolios managed by Horizons Investment. Horizons Investment is the investment manager for the Horizons family of ETFs. Daily reports are available at http://www.timingthemarket.ca. Read more from the author/contributor here.
Tags: TechTalk
Posted in Markets| Comments Off

![clip_image002[5] clip_image002[5]](http://advisoranalyst.com/glablog/wp-content/uploads/HLIC/22f12e43ea6024fb7b97f5b500879f59.png)
