High Yield Liquidity: High and Dry?
By Patrick Flynn Senior Portfolio Manager, Neuberger Berman
Since the world’s investment banks were hit by a wave of new regulation following the 2007-09 financial crisis, the trading environment for fixed income credit has changed out of all recognition.
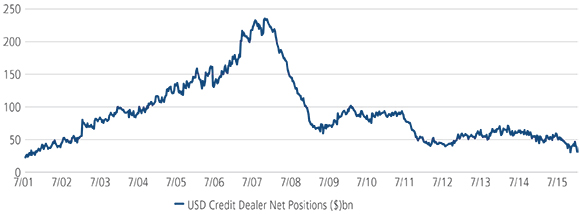
The Third Basel Accord (Basel III), which introduces higher capital requirements and risk-based capital charges, and the “Volcker Rule” embedded in the U.S. Dodd-Frank Act, which severely constrains banks’ proprietary trading capacity, have combined to make it costly and difficult for investment-bank dealer desks to hold inventories of securities on their balance sheets. Net dealer positions in both investment grade and non-investment grade credit have plummeted as a result (figure 1).
1. Investment Banks Are Providing Much Less of a Liquidity Buffer to Credit Markets

Source: Federal Reserve Bank of New York
A Smaller Bank Liquidity Buffer Has Not Dampened Trading
These positions played a key role in fixed income markets: by holding onto bonds that markets are selling, and offering up bonds that markets are buying, they removed the need to match up buyers and sellers immediately—and that buffer kept the spread between bid and ask prices tight. Now that a large chunk of that inventory has gone and banks require greater compensation to hold what’s left, has the ability to trade high-yield bonds in particular been constrained, and has the cost of trading risen?
Let’s take the ability to trade first. While the number of bonds being held by bank dealers has collapsed, the size of the high-yield market has grown substantially over the same period. As that implies, the amount of investor capital being directed into high yield has increased. To some extent, this marginal capital has replaced the lost bank liquidity.
While global high-yield market turnover is below where it was a decade ago, it has actually recovered a lot since 2011 (figure 2). Transaction volume in high yield in 2015, if we include the institutional-only 144A bonds that make up approximately 30% of the market, averaged $10.7bn per day in 2015, up from $8.5bn per day in 2014.
2. High-Yield Market Turnover Has Declined Even As The Markets Themselves Expanded

Source: Bloomberg
Trading Costs Have Not Risen Materially for Most Bonds
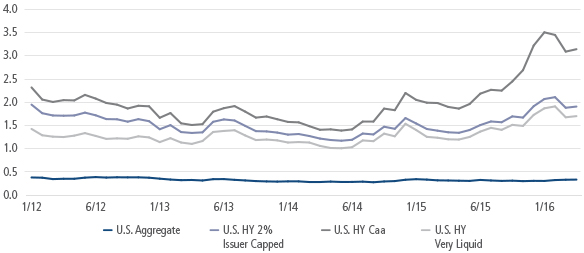
As for costs, when we consider the theoretical ‘round-trip’ liquidity cost for credit markets—instantaneously buying and then selling the same security—life has become more expensive for most of the high-yield universe, but not materially.
Among lower-quality CCC-rated bonds round-trip costs have been markedly more volatile, but we believe that has more to do with risk aversion than with structural or systemic changes in market liquidity. We have seen this kind of spread-widening in CCCs through many previous credit market sell-offs.
Against this overall benign environment we would observe that there are some areas in the asset class, such as sub-$500m high-yield bond issues, that have always been less liquid. While trading these assets has not become meaningfully more expensive in normal conditions, during sell-offs prices may now drop more sharply than in more liquid parts of the market. Before, dealer desks would have provided the liquidity to ensure that prices fell more in-line with credit quality than with size or other technical factors.
3. Only The Lowest-Rated High-Yield Bonds Have Seen Liquidity Costs Rise Meaningfully Since The Financial Crisis
Liquidity Cost Scores For A Variety Of Credit Markets (%)

Source: Barclays POINT. Data as of 27 April, 2016. Us Aggregate is represented by the Barclays US Aggregate Index, US HY by the Barclays US Corporate High Yield 2% Issuer Capped Index, the Barclays High Yield US CAA Index and the Barclays High Yield Very Liquid Index. Liquidity cost score is the cost as a percentage of a bond's price to execute a round-turn transaction. It is driven by TRACE trading volume, sector, subordination, size, age, credit spread, etc, and has been shown strongly correlated to other market liquidity indicators such as VIX, TED spread, and credit spread level. It is computed by Barclays monthly.
Staying Robust Against Potential Liquidity Squeezes
What are the portfolio management implications of these changing conditions?
More than ever before, investors buying CCC-rated bonds will need to rely on rigorous credit analysis rather than assume that liquidity will be available should they change their view on a bond or issuer. This is now very much a buy-and-maintain world.
Less liquid parts of the high-yield universe could present value opportunities for funds that are structured to take advantage of them, with longer lock-ups for investor capital, for instance. Sellers in these markets are usually either offering short-term liquidity to their end-investors (credit hedge funds and high-yield bond and loan funds) or are forced to offload by their structures (CLOs).
For liquid, open-ended funds operating in publicly-traded high-yield bond markets, particularly given the rapid rise of open-ended exchange traded funds (ETFs), the changing environment is more of a risk to be managed than an opportunity to exploit.
Many credit portfolios are now more diversified and more focused on new issues than before 2008. Managers can exclude the least liquid parts of the high-yield universe and still have a good 80-90% of the high-yield market to choose from, and maintaining a good proportion of one-to-three year maturities that tend to be easier to sell in times of stress can help, as well. Finally, looking into who holds particular issues and avoiding those where a single investor dominates can make a big difference to liquidity when sentiment turns down.
In summary, it appears that the substantial shrinkage in banks’ high-yield inventories has materially affected neither transaction volumes nor dealing costs for the vast majority of the market, most of the time. Nonetheless, where liquidity was tight before, it is even tighter today—presenting value opportunities for patient capital in appropriate fund structures. And the new liquidity infrastructure has yet to be truly tested in a credit bear market: for that reason, portfolio managers should implement sensible policies to manage potential illiquidity risk.
This material is provided for informational purposes only and nothing herein constitutes investment, legal, accounting or tax advice, or a recommendation to buy, sell or hold a security. Information is obtained from sources deemed reliable, but there is no representation or warranty as to its accuracy, completeness or reliability. All information is current as of the date of this material and is subject to change without notice. Any views or opinions expressed may not reflect those of the firm as a whole. Neuberger Berman products and services may not be available in all jurisdictions or to all client types.
This material may include estimates, outlooks, projections and other “forward-looking statements.” Due to a variety of factors, actual events may differ significantly from those presented. Investing entails risks, including possible loss of principal. Diversification does not guarantee profit or protect against loss in declining markets. Indexes are unmanaged and are not available for direct investment. Past performance is no guarantee of future results.
This material is being issued on a limited basis through various global subsidiaries and affiliates of Neuberger Berman Group LLC. Please visit www.nb.com/disclosure-global-communications for the specific entities and jurisdictional limitations and restrictions. The “Neuberger Berman” name and logo are registered service marks of Neuberger Berman Group LLC.
Certain products and services may not be available in all jurisdictions or to all client types.
© 2009-2016 Neuberger Berman LLC. | All rights reserved
Founded in 1939, Neuberger Berman is an independent, employee-owned investment manager. The firm manages equities, fixed income, private equity and hedge fund portfolios for global institutions, advisors and individuals. With offices in 19 countries, Neuberger Berman’s team is approximately 2,100 professionals and was named by Pensions & Investments as a Best Place to Work in Money Management for 2013, 2014, and 2015. Tenured, stable and long-term in focus, the firm fosters an investment culture of fundamental research and independent thinking. For important disclosures: http://www.nb.com/disclosure-global-communications Contact Us: Advisor Solutions (877) 628-2583 advisor@nb.com RIA & Family Office (888) 556-9030 riadesk@nb.com


