by Don Vialoux, Timingthemarket.ca
Pre-opening Comments for Friday May 13th
U.S. equity index futures were lower this morning. S&P 500 futures slipped 1 point in pre-opening trade.
Index futures recovered slightly following release of economic news released at 8:30 AM EDT. Consensus for April Retail Sales was an increase of 0.8% versus a decline of 0.3% in March. Actual was an increase of 1.3%. Excluding auto sales, consensus for April Retail Sales was an increase of 0.5% versus a gain of 0.2% in March. Actual was an increase of 0.8%. Most of the gains in April came from on-line sales. Consensus for April Producer Prices was an increase of 0.3% versus a decline of 0.1% in March. Actual was an increase of 0.2%. Excluding food and energy, consensus for April Producer Prices was an increase of 0.1% versus a decline of 0.1% in March. Actual was an increase of 0.1%.
Allergan added $4.38 to $220.40 after Goldman Sachs added the stock to its Conviction Buy list.
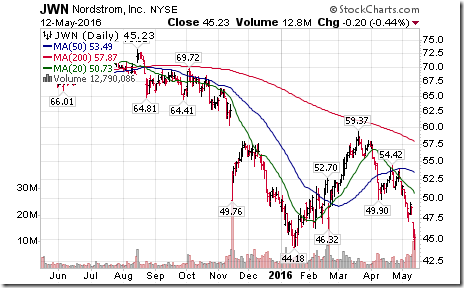
JC Penney fell $0.71 to $7.09 and Nordstrom plunged $6.40 to $38.83 after reporting lower than consensus first quarter results.
Other companies that reported first quarter results overnight included Shake Shack, Honda and NVIDIA.
Comerica (CMA $42.69) is expected to open lower after Wells Fargo downgraded the stock to underperform from market perform.
Johnson & Johnson slipped $0.44 to $113.79 after BTIG downgraded the stock to Neutral from Buy.
EquityClock’s Daily Market Comment
Following is a link:
http://www.equityclock.com/2016/05/12/stock-market-outlook-for-may-13-2016/
Note seasonality chart on Apple
Daily Observations
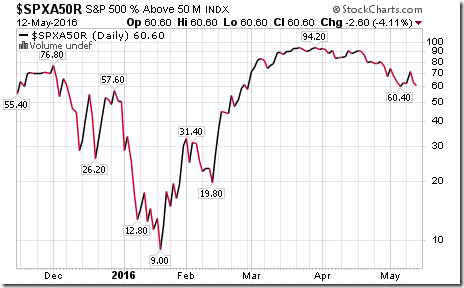
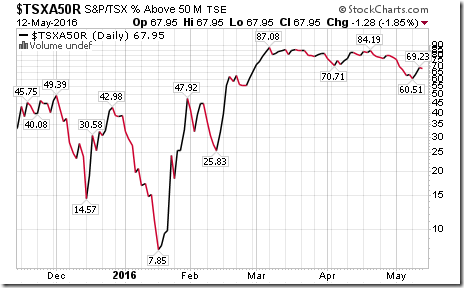
Momentum barometers for S&P 500 and TSX Composite stocks continued to drift lower yesterday from intermediate overbought levels.
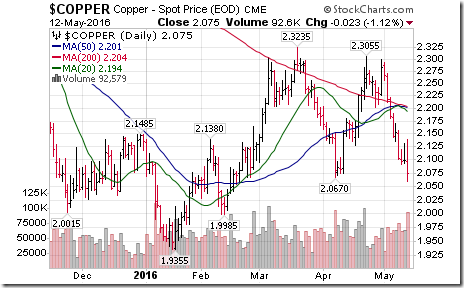
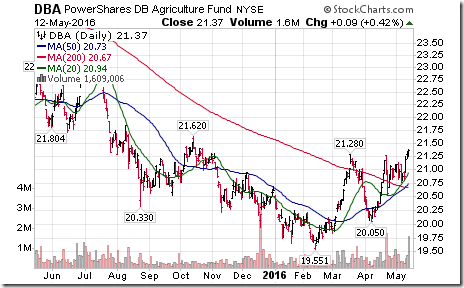
Commodity prices are diverging:
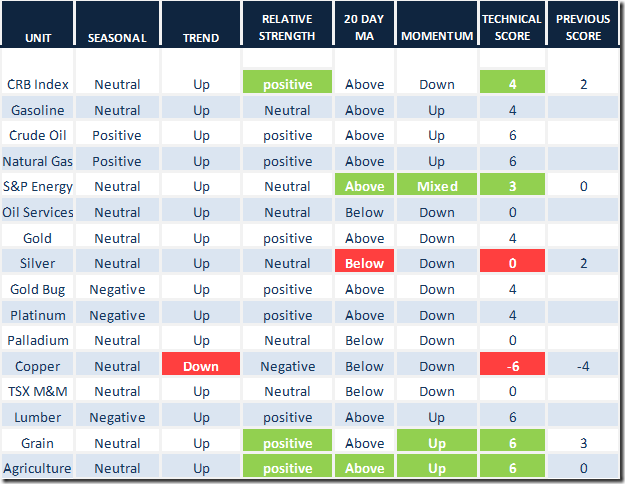
Copper dropped to a 10 week low
The Agriculture Products ETF broke to a 6 month high, thanks mainly to strength in grain prices.
Retail stocks are in for another tough trading day today following release by Nordstrom’s of significantly lower than consensus first quarter earnings after the close. The stock traded below $38 in after hour’s trading.
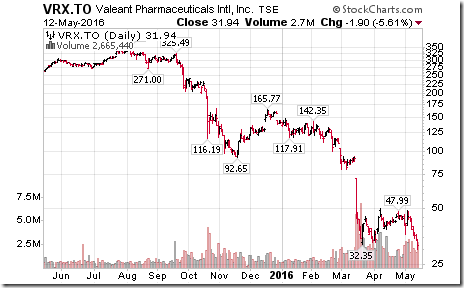
Investor confidence in Valeant Pharmaceutical continues to deteriorate. The stock broke support in Canadian and U.S. Dollars yesterday to reach a 6 year lows in U.S. Dollars. Valeant bond prices also were hit.
StockTwits Released Yesterday @EquityClock
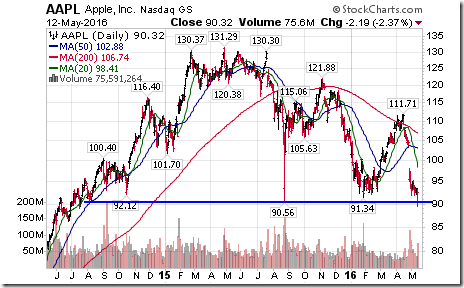
Technical action by S&P 500 stocks to Noon: Mixed. Breakouts: $RAI, $CA, $MON. Breakdowns: $HBI, $CF, $AAPL
Editor’s Note: Two more S&P 500 stocks broke support after Noon: Micron and Humana
Weakness in U.S. equities before Noon was triggered by a breakdown by $APPL below long term support near $90.56.
Editor’s note: U.S equity indices subsequently recovered in the afternoon to near breakeven
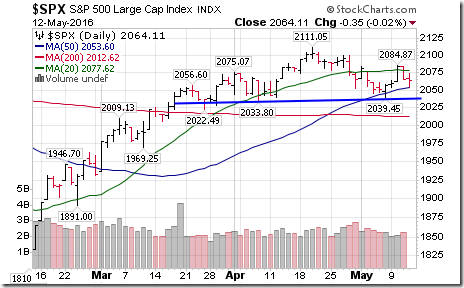
Short term head and shoulders topping pattern becoming apparent on S&P 500 Index $SPX $SPY $ES_F
Editor’s Note: The pattern is completed on a move below 2,039.45
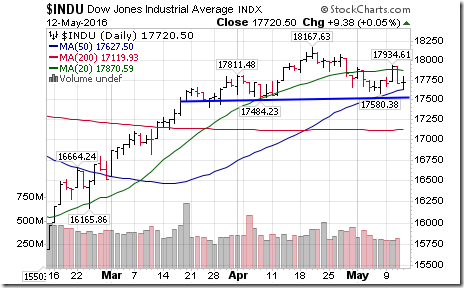
The Dow Jones Industrial Average has a similar technical pattern with completion on a move below 17,580.38
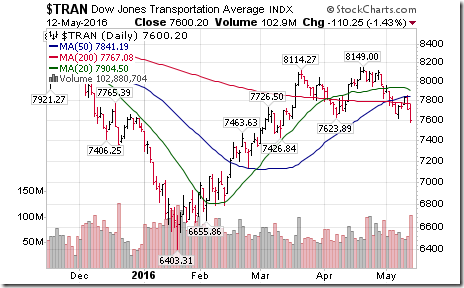
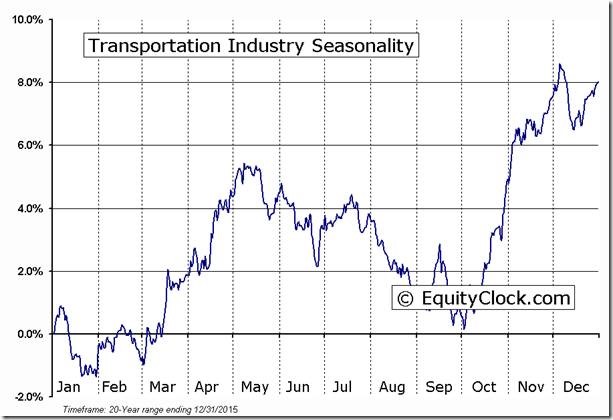
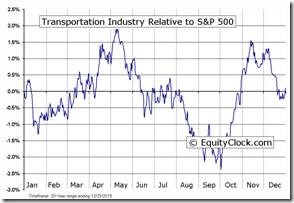
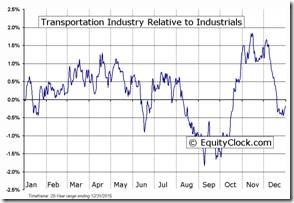
The Dow Jones Transportation Average and its related ETF (IYT) already have broken below support to complete a double top pattern.
‘Tis the season for the Dow Jones Transportation Average to move lower on a real and relative basis!
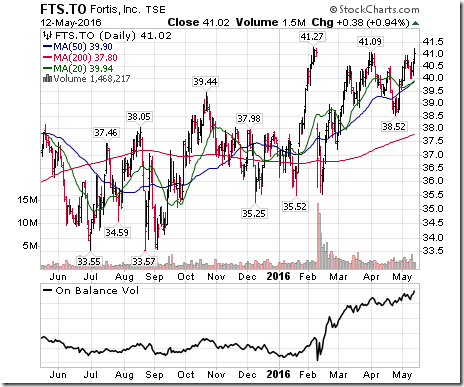
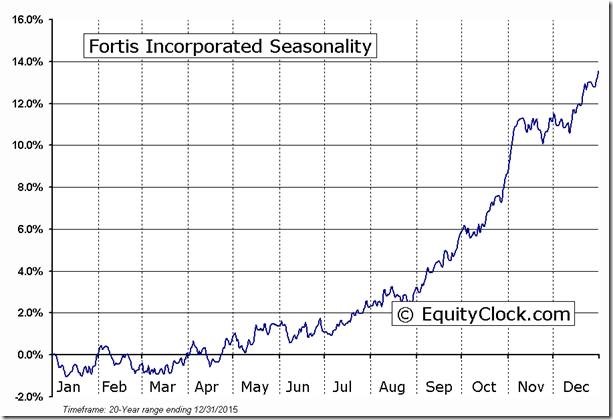
Nice breakout by $FTS.CA above $41.09. Testing all-time high at $41.27. OBV show strong accumulation.
‘Tis the season for Fortis to move higher to the end of October!
Trader’s Corner
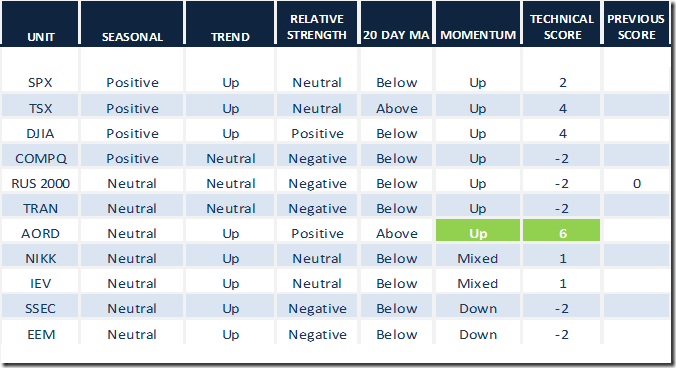
Daily Seasonal/Technical Equity Trends for May 12th 2016
Green: Increase from previous day
Red: Decrease from previous day
Daily Seasonal/Technical Commodities Trends for May 12th 2016
Green: Increase from previous day
Red: Decrease from previous day
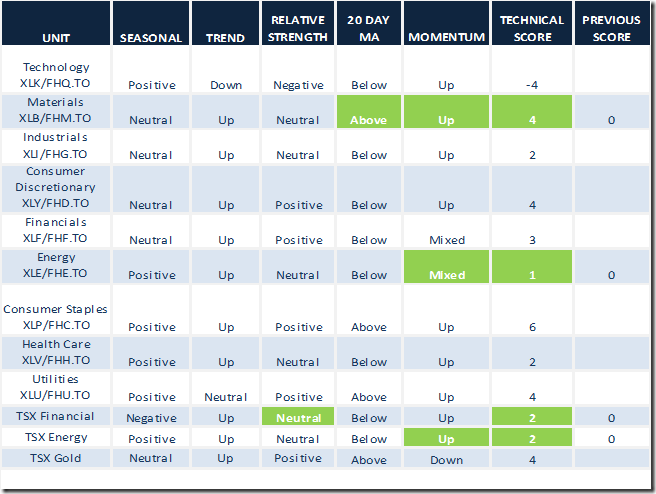
Daily Seasonal/Technical Sector Trends for March May 12th 2016
Green: Increase from previous day
Red: Decrease from previous day
Special Free Services available through www.equityclock.com
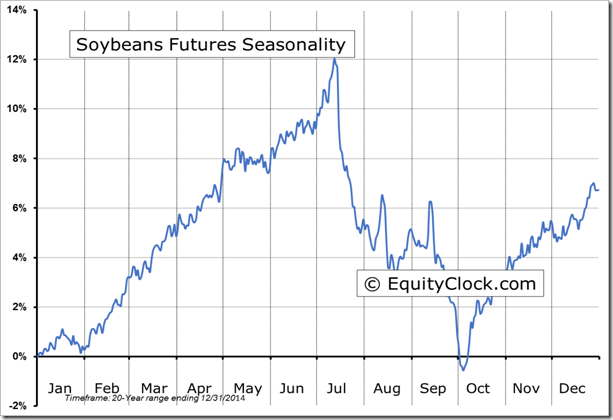
Equityclock.com is offering free access to a data base showing seasonal studies on individual stocks and sectors. The data base holds seasonality studies on over 1000 big and moderate cap securities and indices. To login, simply go to http://www.equityclock.com/charts/ Following is an example:
S&P 500 Momentum Barometer
S&P 500 Momentum Barometer dropped 2.60 to 60.60
TSX Composite Momentum Barometer
TSX Composite Momentum Barometer slipped 1.28 to 67.95
Disclaimer: Seasonality and technical ratings offered in this report by www.timingthemarket.ca and www.equityclock.com are for information only. They should not be considered as advice to purchase or to sell mentioned securities. Data offered in this report is believed to be accurate, but is not guaranteed
Copyright © DV Tech Talk, Timingthemarket.ca


