



Two and a half years after the first edition, MUFG's Capital Markets Strategy team has gone back to the map room. The Art of Cartography (Part 2), published in August 2026 by Tom Joyce, Stephanie Kendal and Angela Sun, opens not with a forecast but with Ernest Shackleton on the human impulse to reach into the unknown. That framing is deliberate. This is not a house view dressed as data. It is a set of coordinates, and the coordinates have moved.
Growth Holds. The Compass Spins.
Joyce titles his opening map "Resilient Though Subdued Global Growth in 2026," and the adjectives are doing equal work. The US grows 2.3% and India 6.7%, while Canada and the Eurozone both manage just 0.7%, Japan 0.5%, and the UAE contracts 1.1%. Resilient in aggregate. Subdued almost everywhere that isn't emerging Asia.
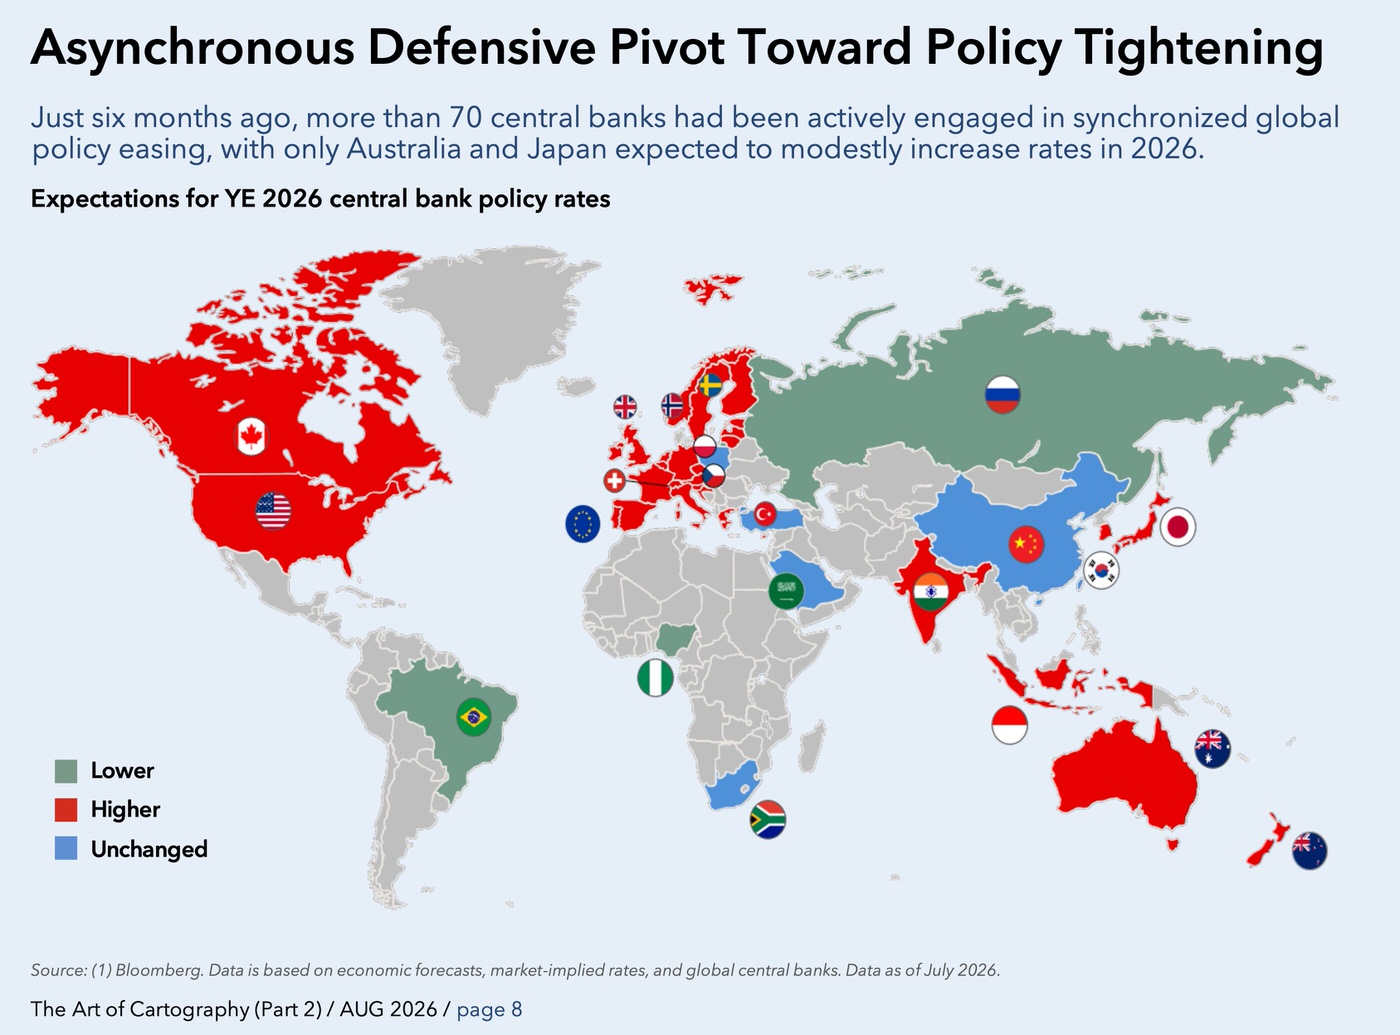
The more consequential map is the rate map. Joyce calls it an "Asynchronous Defensive Pivot Toward Policy Tightening," noting that just six months ago more than 70 central banks were engaged in synchronized easing, with only Australia and Japan expected to hike in 2026. Today the US, Canada, Australia and much of Europe are expected to finish the year higher, while Brazil, Russia, Nigeria and Saudi Arabia go the other way. For advisors, the operative fact is no longer direction. It is dispersion.
Underneath sits the slow variable. More than two-thirds of the world now lives below the 2.1 replacement fertility rate: Europe at 1.41, North America at 1.60, with Africa the only region meaningfully above at 3.89. The over-65 population doubles to roughly 1.6 billion by 2050, and the IMF sees aging shaving 0.5 to 1 percentage point off advanced economy growth annually. Hence Joyce's header, "Productivity as Critical Offset to Aging Demographics." That is the AI capex thesis stated demographically rather than technologically, and it is the more durable version of the argument.
The Center of Gravity Has Moved
Two maps placed side by side do the work of an entire chapter. In 2000, the EU was the largest trading partner to most of the world. By 2025, China is, at $6.4 trillion in goods trade against $5.6 trillion each for the US and EU. Seven of the ten largest container ports are Chinese.
The policy response is now measurable. Effective US tariff rates run 24.6% on China, 17.2% on Turkey, 13.5% on Indonesia and 5.1% on Canada. The Section 301 forced labor tariffs, tiered at 10% and 12.5%, took effect July 24, and 25 states filed suit at the Court of International Trade on August 3. The next probe targets structural excess manufacturing capacity across 16 economies representing roughly 75% of US imports. Nearly 50 countries are pursuing digital services taxes into the teeth of a threatened 100% tariff. Meanwhile the January 2026 OECD "side-by-side" arrangement leaves the US as the only country with a Pillar 2 carveout.
To be clear, none of this is settled. The USMCA renegotiation sits atop a map showing North Dakota sending 90% of its exports to Canada and Mexico, and Michigan 65%. The political economy of an unwind is not obviously favourable to the states pushing hardest.
Chokepoints and Toll Booths
The geopolitical section is titled "From World Order to Regional Disorder," and the March 2026 US-Iran war supplies the case study. Joyce's point is that the war's distinguishing feature is not the tonnage of strikes, which trails 1991 and 2003, but the oil disruption and the Hormuz closure. Iran has shut over 95% of traffic while rerouting a handful of ships north of Larak Island, which Joyce labels, with some economy, "Tehran as Toll Collector." Exposure is asymmetric: India 28% of gas consumption, Taiwan 27%, Pakistan 26%, against Europe at 3%.
The commodity maps sharpen the same theme. China holds 59% of rare earth reserves, but Joyce is careful to note that its real leverage "lies further up the value chain in production and refining." Reserves are geology. Refining is policy.
The Compute Map
US private AI investment from 2013 to 2025 totals $757 billion against China's $132 billion, and projected 2026 spend is $2.0 trillion versus $355 billion. Virginia hosts nearly 700 data centers; Texas has more than 400 and is projected to overtake it by 2028, led by an 8,000-acre, 7.65 GW campus in Pecos County. The constraint is arriving on schedule: 20 states have introduced restriction bills, New York has passed the first moratorium, and municipalities in over 30 states have enacted local ones. Over 70% of North American AI venture funding still lands in the Bay Area. Concentration is the risk nobody is pricing.
Five Takeaways for Advisors and Investors
- Dispersion is the trade. With central banks pivoting asynchronously, currency and duration positioning matter more than a single rate call.
- Tariffs are now structural, not episodic. Section 301 rests on more durable legal footing than the emergency measures it replaced, and litigation risk cuts both ways.
- Energy risk is a maritime risk. Hormuz exposure argues for Asia-aware, not just oil-aware, portfolio hedging.
- Critical minerals dominance is a refining story. Reserve maps flatter the West and mislead investors.
- AI's binding constraint is power and permits. Watch state moratoriums as closely as chip incentives.
It is simply too early to tell which of these maps proves the most consequential. The facts will tell us.
Footnote:
1 Joyce, Tom, Stephanie Kendal, and Angela Sun. "The Art of Cartography (Part 2): Maps that Matter for Markets in 2026." Capital Markets Strategy, MUFG, Aug. 2026, https://www.mufgamericas.com/sites/default/files/document/mufgamericas_com/2026-08/Art-of-Cartography-2.pdf.