by Don Vialoux, EquityClock.com
Technical Notes released yesterday at
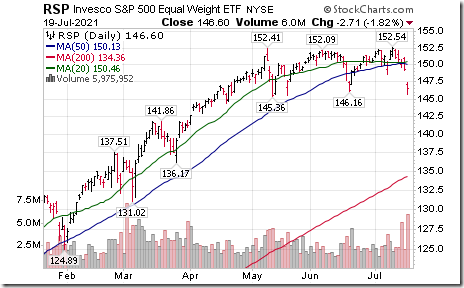
Equal Weight S&P 500 ETF $RSP moved below $146.16 completing a modified Head & Shoulders pattern.
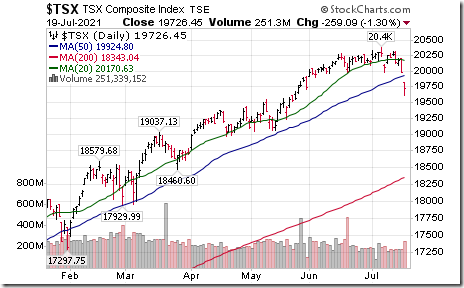
TSX Composite Index $TSX.CA moved below $19,980.32 moved below 19,980.32 and the TSX 60 Index $SPTSE moved below $1,197.95 completing short term Head & Shoulders patterns.
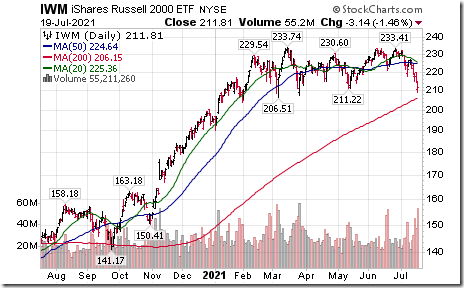
Russell 2000 iShares $IWM moved below $211.22 completing a double top pattern.
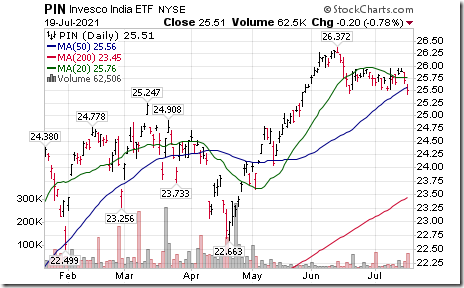
India ETF $PIN moved below $25.44 completing a double top pattern.
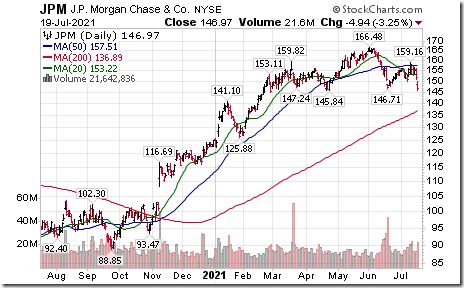
J P Morgan, a Dow Jones Industrial Average stock $JPM completed a classic Head & Shoulders pattern by moving below $146.71
S&P 100 stocks moving below intermediate support by 10:00 AM EDT included $GM, $MAR $CAT, $UNP, $DOW and $DD
Editor’s Note: Other S&P 100 and NASDAQ 100 stocks that moved below intermediate support after 10:00 AM EDT included MTCH, BRK.B, JPM, CSX, CTSH, FISV, ATVI, MCD, CVS, GD, PDD, ROST, AIG and IBM
ETFs moving below intermediate support at 10:00 AM EDT included $MOO $XLB $MDY $SLX, $PPA $CARZ $COPX $IEV and $EWA
Editor’s Note: Other major ETFs that moved below intermediate support after 10:00 AM EDT included: XLF, XLI, EZU, EEM, IYT, WOOD, EZA, EWH, UGA, XHB, GDX, XBM.TO, COW.TO and XFN.TO.
TSX 60 stocks that have moved below intermediate support today included $BIP $TRP.CA $TECK $BAM.A.CA $QSR.CA $KGC, $WPM, $SAP and $GIB
Charting the second half: StockCharts.com expert panel
Following is a link:
https://www.youtube.com/watch?v=Ldqw5_niSVY
Trader’s Corner
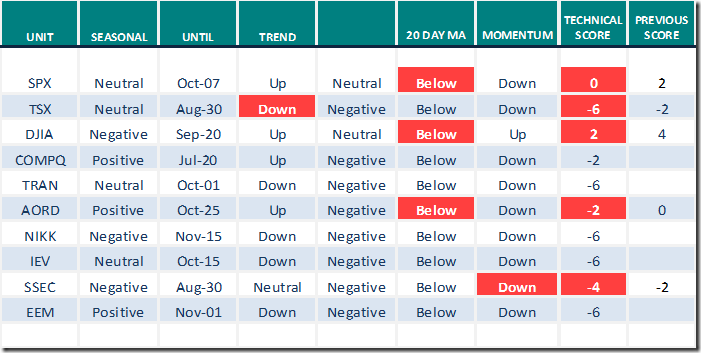
Equity Indices and Related ETFs
Daily Seasonal/Technical Equity Trends for July 19th 2021
Green: Increase from previous day
Red: Decrease from previous day
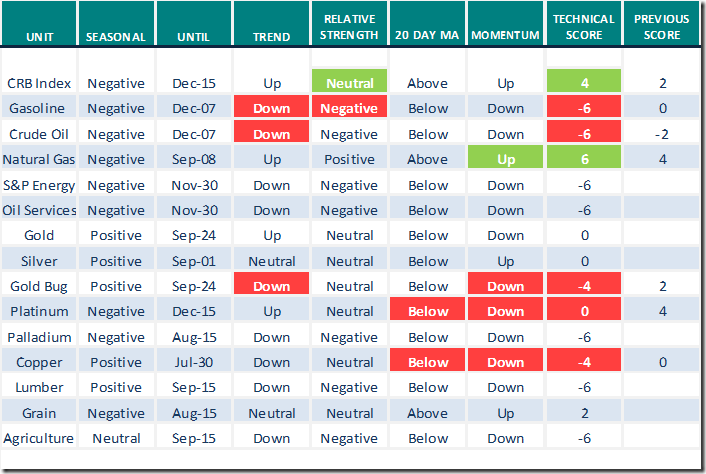
Commodities
Daily Seasonal/Technical Commodities Trends for July 16th 2021
Green: Increase from previous day
Red: Decrease from previous day
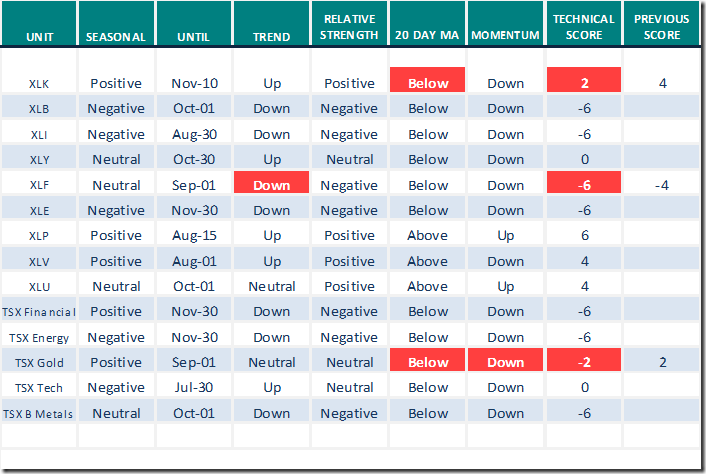
Sectors
Daily Seasonal/Technical Sector Trends for July 19th 2021
Green: Increase from previous day
Red: Decrease from previous day
All seasonality ratings are based on performance relative to the S&P 500 Index
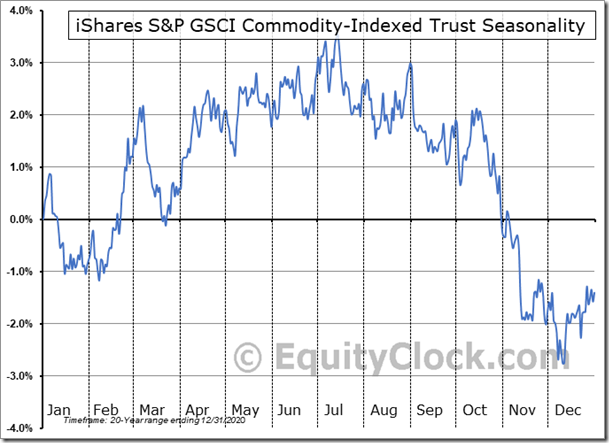
Seasonality Chart of the Day from www.EquityClock.com
Industrial commodity prices on a real and relative basis (relative to the S&P 500 Index) have a history of moving lower between now and December 15th
S&P 500 Momentum Barometers
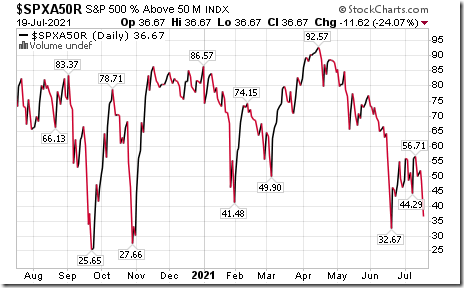
The intermediate term Barometer plunged 11.62 to 36.67 yesterday. It changed from Neutral to Oversold on a move below 40.00, but is trending down.
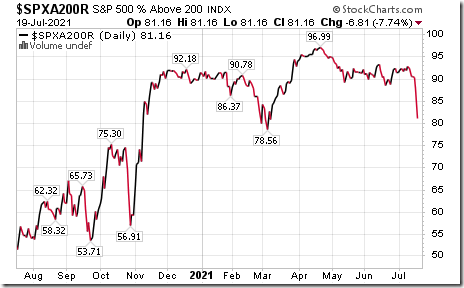
The long term Barometer plunged 6.81 to 81.16 yesterday. It remains Extremely Overbought.
TSX Momentum Barometers
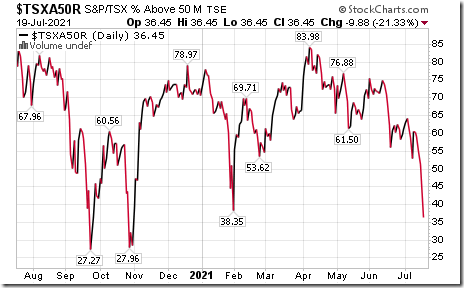
The intermediate term Barometer plunged 9.88 to 36.45 yesterday. It changed from Neutral to Oversold on a move below 40.00 and continues to trend down.
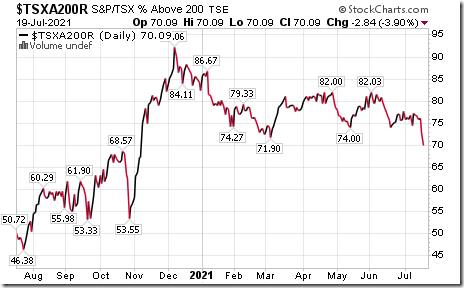
The long term Barometer dropped 2.84 to 70.09 yesterday. It remains Overbought and continues to trend down.
Disclaimer: Seasonality and technical ratings offered in this report and at
www.equityclock.com are for information only. They should not be considered as advice to purchase or to sell mentioned securities. Data offered in this report is believed to be accurate, but is not guaranteed
This post was originally publised at Vialoux's Tech Talk.


