


by John Lynch, CIO, & Team, Comerica Wealth Management
Despite the year-to-date strength in equity prices, other market signals suggest rising concerns as market interest rates are climbing, oil prices remain elevated and the U.S. dollar holds firm.
Executive Summary
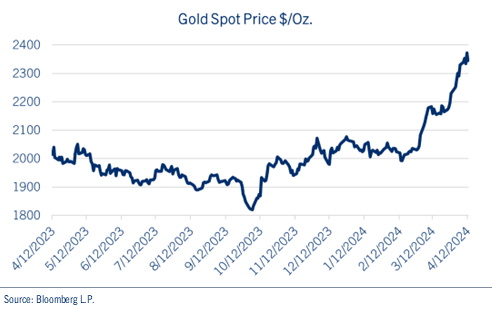
- Gold’s recent surge of nearly 18.0% since mid-February is fueled by its dual role as a safe-haven asset and an inflation hedge, amidst geopolitical tensions and firming economic data dimming hopes for extensive monetary easing this year.
- The March CPI report revealed a surge in both headline and Core CPI, exceeding forecasts for the third consecutive month, with CPI reaching 3.5% from a year earlier. Despite progress in 2023, reaching the Fed’s 2.0% target remains challenging.
- Market expectations for rate cuts have fallen precipitously this year, with investors currently pricing in fewer than two cuts by year-end. Minutes from March’s FOMC’s March meeting revealed that it is considering easing the pace of quantitative tightening. This decision has less to do with market interest rates, rather the Fed is attempting to avoid a repeat of 2019’s “taper tantrum.”
Economic growth remains robust, supporting corporate earnings and suggesting any near-term weakness may be short-lived. Initial support for the S&P 500® Index is at the 50-day moving average (DMA) of 5100 and longer-term support in the 4850-4900 range, suggesting the possibility for a pullback in the 5.0% to 6.0% range.
Gold
The “Barbarous Relic” continues to gain momentum, fortified by a combination of technical tailwinds and its characteristics as both a safe-haven and an inflation hedge.
Gold has surged nearly 18.0% since mid-February as firming economic data diminished investor hopes for an extensive period of monetary easing this year and geopolitical tensions escalated. See chart: Gold Spot Price $/Oz.
To be sure, gold has exhibited both offensive and defensive characteristics over its ~5,000-year history. During tense geopolitical periods, its status as a haven has drawn the interest of concerned investors, while strong economic times boosted demand from those on Wall Street seeking an offset from inflationary pressures.
While each of those circumstances exist today, gold prices are also benefitting from an attractive technical chart pattern. Having hovered in the $1,650.00 to $2,050.00 range over the past three years, the technical pattern known as range measurement suggests the late March breakout could see gold climb as high as $2,500.00 to $2,600.00 in the weeks/months ahead.
Another, and perhaps more important factor, is the dynamic between persistent pricing and messaging from the Federal Reserve. Economic data has surprised to the upside this year, yet monetary policymakers remain dovish, suggesting gold may also be pricing in the prospect of a policy mistake.
March CPI Report
The March CPI report delivered unwelcomed news for both the Fed and investors. Both headline CPI and Core CPI, which excludes food and energy prices, surged by 0.4% in March, surpassing the consensus estimate of 0.3% for each measure. This marks the third consecutive month of CPI readings exceeding forecasts. From a year earlier, CPI rose to 3.5%, while Core CPI remained steady at 3.8%. See chart: Consumer Price Index (CPI).
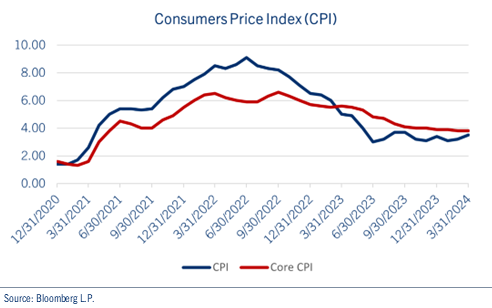
Despite significant progress on inflation in 2023, the disinflationary trend has stalled since the beginning of the new year. Liquidity levels remain strong as measured by the money supply, which shows M2 of approximately $20.5 trillion. The Federal deficit as a percentage of GDP (~7.0%) is alarming, especially in the context of full employment. To be sure, the move from 9.0% YOY inflation in 2022 to 3.0% CPI last year was impressive, yet the journey from 3.0% to the Fed’s preferred target of 2.0% is proving much more difficult.
Federal Reserve
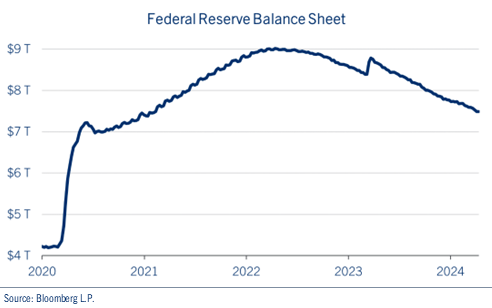
In addition to remaining firm on its plans to cut rates three times this year, insights from March's FOMC meeting minutes indicate that policymakers are nearing a decision to ease the pace of quantitative tightening. Over the past two years, the Fed has been gradually reducing its balance sheet, allowing up to $95 billion in Treasury and mortgage-backed securities to mature each month. As a result, approximately $1.6 trillion has been removed from the Fed's balance sheet thus far. See chart: Federal Reserve Balance Sheet.
In principle, this reduction can exert upward pressure on interest rates, as investors must absorb a larger supply of bonds. Slowing down this process would alleviate some of that pressure. However, the motivation behind tapering the reduction is not primarily about controlling interest rates. Instead, the Fed aims to avoid a repeat of the "taper tantrum" of 2019, when overnight money market rates surged, compelling the Fed to reverse its course.
Considering traditional interest rate policy targeting the overnight lending rate, despite Fed messaging, the Fed Funds Futures markets have significantly reduced expectations for the timing and extent of rate cuts. The implied year-end rate now sits at 4.9%, suggesting just two cuts this year from an earlier projection of six cuts, with the first reduction postponed from June to September. See chart: Year-End 2024 Fed Funds Rate Expectations.
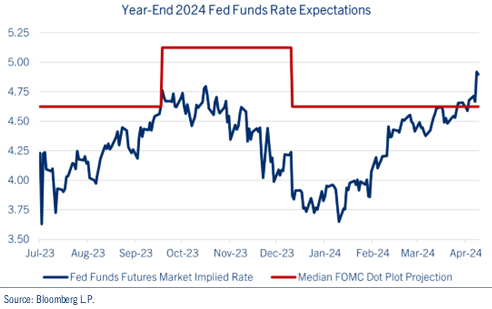
Indeed, Fed Funds Futures markets are now predicting fewer cuts than the median Fed projection released quarterly following March’s FOMC meeting.
Conclusion
Despite the year-to-date strength in equity prices, other market signals suggest rising concerns as market interest rates are climbing, oil prices remain elevated, and the U.S. dollar holds firm.
Gold prices are benefitting from technical patterns and its offensive and defensive characteristics. Inflation persists higher, and monetary policymakers are suddenly in the uncomfortable position of being more dovish than the financial markets.
We are entering a period of seasonal weakness, and as we wrote several weeks ago, a pause is plausible. Yet economic growth is strong, and we look for corporate earnings to help support valuations in the quarters ahead. See chart: S&P 500® Index.
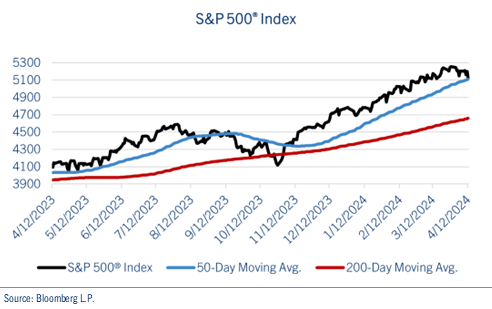
Since the longer-term or secular trend remains favorable, any near-term or tactical weakness may prove short-lived. Initial support for the S&P 500® Index is at the 50-day moving average (DMA) of 5100 and longer-term support in the 4850-4900 range, suggesting the possibility for a pullback in the 5.0% to 6.0% range. We encourage investors to use any near-term weakness as an opportunity to rebalance portfolios back toward longer-term target allocations.
Be well and stay safe!
Contributors
John Lynch
Chief Investment Officer
Comerica Wealth Management
Deborah Koplik
Director Portfolio Management
Comerica Wealth Management
Matthew Anderson
Senior Analyst
Comerica Wealth Management


