


by John Lynch, CIO, & Team, Comerica Wealth Management
Executive Summary
The S&P 500® Index had its best week since November, buoyed by strong earnings reports from Big Tech, despite lackluster economic data. The latest GDP report, which showed economic expansion surprise to the downside and inflation surprise to the upside gave off a whiff of stagflation. However, deeper analysis suggests the underlying factors are likely temporary in nature.
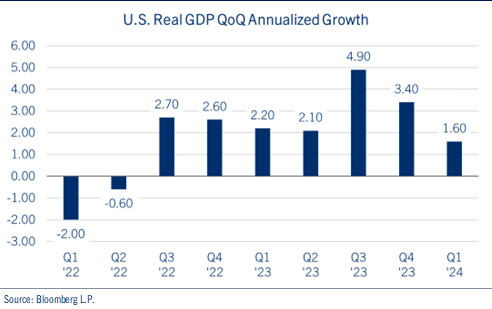
- U.S. economic growth fell short of expectations in the first quarter, with real GDP growth slowing to 1.6%, below the consensus forecast of 2.5%. However, the labor market and consumer spending remain robust, alleviating concerns of a significant slowdown.
- Inflation, as measured by Personal Consumption Expenditures (PCE) index, surprised to the upside following upward revisions in January and February. Due to the seasonality effects at the beginning of a new year, drawing conclusions on the disinflationary trend becomes more complicated.
- In equity markets, expectations of robust earnings growth have fostered a risk-on environment as evidenced by Equity Risk Premium (ERP). ERP is currently at its lowest level in more than two decades, potentially limiting future gains. Any revisions to economic growth forecasts may portend increased volatility due to the downstream impacts on corporate profits.
Since much of projected earnings growth is predicated on a strong economy, any material slowdown in economic growth could pressure equities, making the relative safety of fixed income look more appealing. This week’s news on employment, monetary policy and Treasury refunding should help provide clarity for investors.
Download the Weekly Market Update
1Q GDP
U.S. economic growth fell short of expectations in the first quarter, with real GDP growth slowing to 1.6%, below the consensus forecast of 2.5%—marking the slowest quarterly expansion since the second quarter of 2022. Although disappointing, the reasons behind the slowdown are somewhat mitigated. The main drivers of the slowdown include slower inventory accumulation, a widened trade deficit due to a strong U.S. dollar, and stagnant federal government expenditures. On the bright side, consumer spending, especially on services, continued to expand in the first quarter. See chart: U.S. Real GDP QoQ Annualized Growth.
Overall, the first-quarter economic data presents challenges for the U.S. economy but does not necessarily predict an imminent recession. Trade and inventories often swing inversely, so having both negative at the same time is a significant drag – but likely temporary. Undoubtedly, higher policy rates are impacting certain areas of the economy, particularly those reliant on short-term borrowing like credit card borrowers, small businesses and auto loans. Nonetheless, the labor market and consumer spending remain robust, alleviating fears of a significant slowdown.
Inflation
A notable concern highlighted in the GDP report is the Personal Consumption Expenditures (PCE) inflation reading. The data revealed the Fed's preferred inflation gauge, core PCE, surged by an annualized 3.7% quarter-over-quarter, representing a significant upside surprise. However, March core inflation met expectations with a 0.3% month-over-month increase. The surprise stemmed from upward revisions to January and February figures. Because of the seasonal nature of inflation, drawing conclusions about the latest data becomes more complicated. Inflation at the beginning of the year is often higher as many firms traditionally raise prices at the year's outset. See chart: Core PCE Inflation-Month-over-Month.
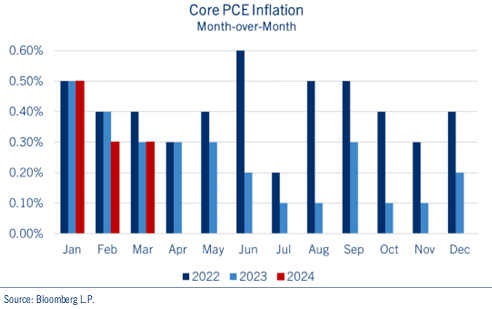
Indeed, the price increases at the beginning of the year could be dismissed as seasonal fluctuations. In 2022, there was another surge in the summer, while in 2023, core PCE inflation moderated.
Following this week's FOMC meeting, we look for the Fed to adopt a more hawkish stance as it awaits further data to ascertain inflation's trajectory in 2024.
Equity Risk Premium
Thus far, equities have largely weathered rising bond yields as investors recalibrate their expectations for rate cuts this year. Expectations of robust earnings growth have fostered a risk-on environment, evident in the equity risk premium (ERP).
The equity risk premium (ERP) measures the attractiveness of equities, in this case the S&P 500®, in relation to interest rates, represented by the yield on the 10-year Treasury note. The ERP aims to capture the additional return that an investor can potentially gain by taking on the risk of holding stocks relative to Treasury bonds.
For instance, given the current S&P 500® P/E ratio of around 21X, the earnings yield for stocks calculates as 1 divided by 21, resulting in approximately 4.75%. When we deduct the yield of the 10-year Treasury note (approximately 4.60%), the equity risk premium comes out to roughly 15 basis points. This value is notably lower than the 20-year average of nearly 340 basis points. See chart: Equity Risk Premium.
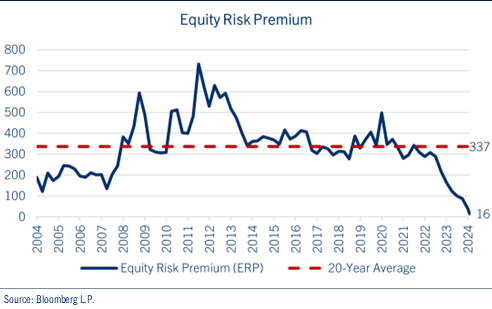
Currently, the ERP is at its lowest level in more than two decades, posing a valuation challenge for equity markets. Since much of projected earnings growth is predicated on a strong economy, any material slowdown in economic growth could pressure equities, making the relative safety of fixed income look more appealing.
Conclusion
First quarter economic data presents both challenges and bright spots for the U.S. economy.
While GDP growth fell short of expectations, consumer spending remained resilient. The surge in core PCE continues to be concerning, but seasonal fluctuations make it difficult to tell whether these concerns are overstated. Despite these challenges, equities have demonstrated resilience amid rising bond yields, fueled by expectations of robust earnings growth. Historically low ERP signals a valuation challenge for equity markets, especially if economic growth falters.
We will be closely monitoring developments this week as the April Jobs report, Treasury Refunding and the FOMC meeting all carry significant market implications.
Be well and stay safe!
Copyright © Comerica Wealth Management
*****
IMPORTANT DISCLOSURES
Comerica Wealth Management consists of various divisions and affiliates of Comerica Bank, including Comerica Bank & Trust, N.A. Inc. and Comerica Insurance Services, Inc. and its affiliated insurance agencies.
Comerica Bank and its affiliates do not provide tax or legal advice. Please consult with your tax and legal advisors regarding your specific situation.
Non-deposit Investment products offered by Comerica and its affiliates are not insured by the FDIC, are not deposits or other obligations of or guaranteed by Comerica Bank or any of its affiliates, and are subject to investment risks, including possible loss of the principal invested.
Unless otherwise noted, all statistics herein obtained from Bloomberg L.P.
This is not a complete analysis of every material fact regarding any company, industry or security. The information and materials herein have been obtained from sources we consider to be reliable, but Comerica Wealth Management does not warrant, or guarantee, its completeness or accuracy. Materials prepared by Comerica Wealth Management personnel are based on public information. Facts and views presented in this material have not been reviewed by, and may not reflect information known to, professionals in other business areas of Comerica Wealth Management, including investment banking personnel.
The views expressed are those of the author at the time of writing and are subject to change without notice. We do not assume any liability for losses that may result from the reliance by any person upon any such information or opinions. This material has been distributed for general educational/informational purposes only and should not be considered as investment advice or a recommendation for any particular security, strategy or investment product, or as personalized investment advice.
Diversification does not ensure a profit or protect against a loss in a declining market. Past performance is no guarantee of future returns. The performance of an index is not an exact representation of any particular investment, as you cannot invest directly in an index. The material is not intended as an offer or solicitation for the purchase or sale of any financial instrument. The investments and strategies discussed herein may not be suitable for all clients.
The S&P 500® Index, S&P MidCap 400 Index®, S&P SmallCap 600 Index® and Dow Jones Wilshire 500® (collectively, “S&P® Indices”) are products of S&P Dow Jones Indices, LLC or its affiliates (“SPDJI”) and Standard & Poor’s Financial Services, LLC and has been licensed for use by Comerica Bank, on behalf of itself and its Affiliates. Standard & Poor’s® and S&P® are registered trademarks of Standard & Poor’s Financial Services, LLC (“S&P”) and Dow Jones® is a registered trademark of Dow Jones Trademark Holdings, LLC (“Dow Jones”). The S&P 500®® Index Composite is not sponsored, endorsed, sold or promoted by SPDJI, Dow Jones, S&P, or their respective affiliates and none of such parties make any representation regarding the advisability of investing in such product nor do they have any liability for any errors, omissions, or interruptions of the S&P Indices.
NEITHER S&P DOW JONES INDICES NOR STANDARD & POOR’S FINANCIAL SERVICES, LLC GUARANTEES THE ADEQUACY, ACCURACY, TIMELINESS AND/OR THE COMPLETENESS OF THE WAM STRATEGIES OR ANY DATA RELATED THERETO OR ANY COMMUNICATION, INCLUDING BUT NOT LIMITED TO, ORAL OR WRITTEN COMMUNCATION (INCLUDING ELECTRONIC COMMUNICATIONS) WITH RESPECT THERETO. S&P DOW JONES INDICES AND STANDARD & POOR’S FINANCIAL SERVICES, LLC SHALL NOT BE SUBJECT TO ANY DAMAGES OR LIABILITY FOR ANY ERRORS, OMISSIONS, OR DELAYS THEREIN. S&P DOW JONES INDICES AND STANDARD & POOR’S FINANCIAL SERVICES, LLC MAKE NO EXPRESS OR IMPLIED WARRANTIES, AND EXPRESSLY DISCLAIM ALL WARRANTIES, OR MERCHANTABILITY OR FITNESS FOR A PARTICULAR PURPOSE OR USE OR AS TO RESULTS TO BE OBTAINED BY COMERICA AND ITS AFFILIATES, OR ANY OTHER PERSON OR ENTITY FROM THE USE OF THE S&P INDICES OR WITH RESPECT TO ANY DATA RELATED THERETO. WITHOUT LIMITING ANY OF THE FOREGOING, IN NO EVENT WHATSOEVER SHALL S&P DOW JONES INDICES OR STANDARD & POOR’S FINANCIAL SERVICES, LLC BE LIABLE FOR ANY INDIRECT, SPECIAL, INCIDENTAL, PUNITIVE, OR CONSEQUENTIAL DAMAGES INCLUDING BUT NOT LIMITED TO, LOSS OF PROFITS, TRADING LOSSES, LOST TIME OR GOODWILL, EVEN IF THEY HAVE BEEN ADVISED OF THE POSSIBILITY OF SUCH DAMAGES, WHETHER IN CONTRACT, TORT, STRICT LIABILITY, OR OTHERWISE. THERE ARE NO THIRD-PARTY BENEFICIARIES OF ANY AGREEMENTS OR ARRANGEMENTS BETWEEN S&P DOW JONES INDICES AND COMERICA AND ITS AFFILIATES, OTHER THAN THE LICENSORS OF S&P DOW JONES INDICES.
“Russell 2000® Index and Russell 3000® Index” are trademarks of Russell Investments, licensed for use by Comerica Bank. The source of all returns is Russell Investments. Further redistribution of information is strictly prohibited.
MSCI EAFE® is a trademark of Morgan Stanley Capital International, Inc. (“MSCI”). Source: MSCI. MSCI makes no express or implied warranties or representations and shall have no liability whatsoever with respect to any MSCI data contained herein. The MSCI data may not be further redistributed or used as a basis for other indexes or any securities or financial products. This report is not approved, endorsed, reviewed or produced by MSCI. None of the MSCI data is intended to constitute investment advice or a recommendation to make (or refrain from making) any kind of investment decision and may not be relied on as such.
FTSE International Limited (“FTSE”) © FTSE 2016. FTSE® is a trademark of London Stock Exchange Plc and The Financial Times Limited and is used by FTSE under license. All rights in the FTSE Indices vest in FTSE and/or its licensors. Neither FTSE nor its licensors accept any liability for any errors or omissions in the FTSE Indices or underlying data.comerica.com/insights