


by Wylie Tollette, CFA, Chief Investment Officer, Franklin Templeton Investment Solutions, Miles Sampson, CFA, Lead Asset Class Analyst, Franklin Templeton Investment Solutions, & Tom Nelson, CFA, Head of Asset Allocation Portfolio Management, Franklin Templeton Investment Solutions
With continued economic growth and elevated inflation levels, the Fed keeps delaying interest-rate cuts. The Franklin Templeton Investment Solutions team provides a historical analysis to make sense of the Fed rate cycle and what it implies for multi-asset investors.
Key points:
- The current macro backdrop is slightly atypical for an impending Federal Reserve (Fed) easing cycle—growth and labor markets remain strong, while inflation levels are elevated despite progress over the past year.
- The policy backdrop is also notable as Federal Open Market Committee (FOMC) members broadly see current policy levels as restrictive.
- In our opinion, the implications for multi-asset investors remain positive for equities. We believe reflationary macro conditions and a peak in the fed funds rate (our base case) are supportive regimes for risk-taking in portfolios.
Is this time different?
Expectations for a Fed easing cycle have evolved tremendously since the beginning of the year, when the market was pricing in approximately six rate cuts. When will it happen, or will it happen, and what does it mean for asset allocation?
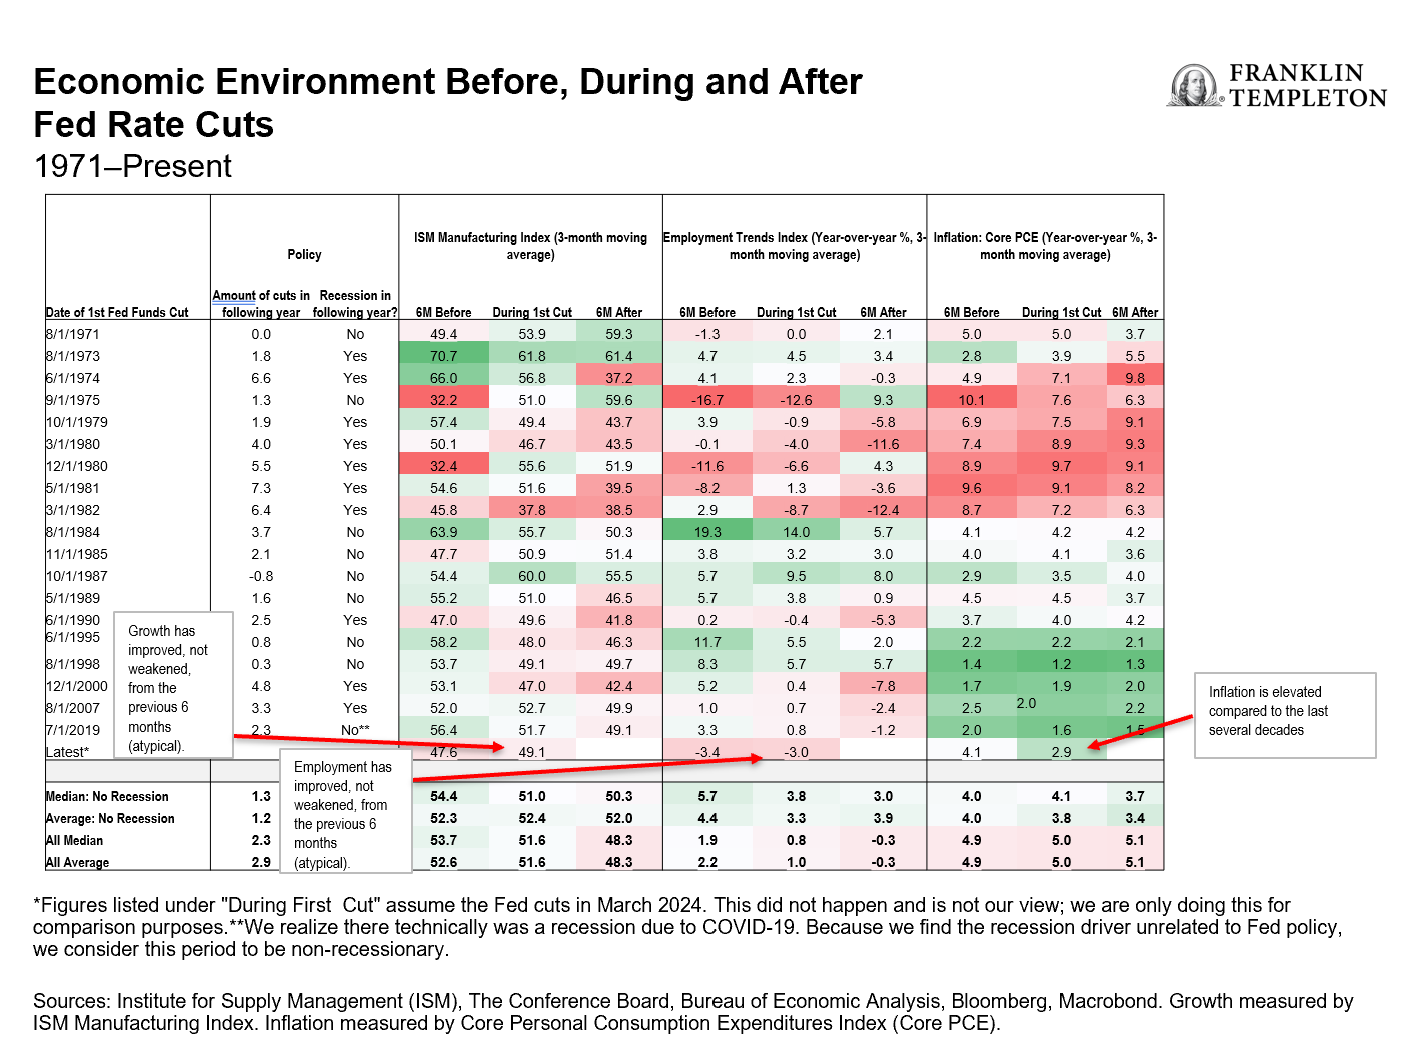
To answer these questions, we start with examining the macro backdrop relative to other Fed easing cycles. The famous question that continually plagues investors bears repeating: “Is this time different?” Through a macro lens, things do appear slightly different—growth and labor are not weakening, and inflation levels remain slightly elevated relative to the previous 30 years despite significant progress since inflation’s peak in 2022 (Exhibit 1).
Exhibit 1: Economic Environment Before, During and After Fed Rate Cuts (right click on chart to enlarge)
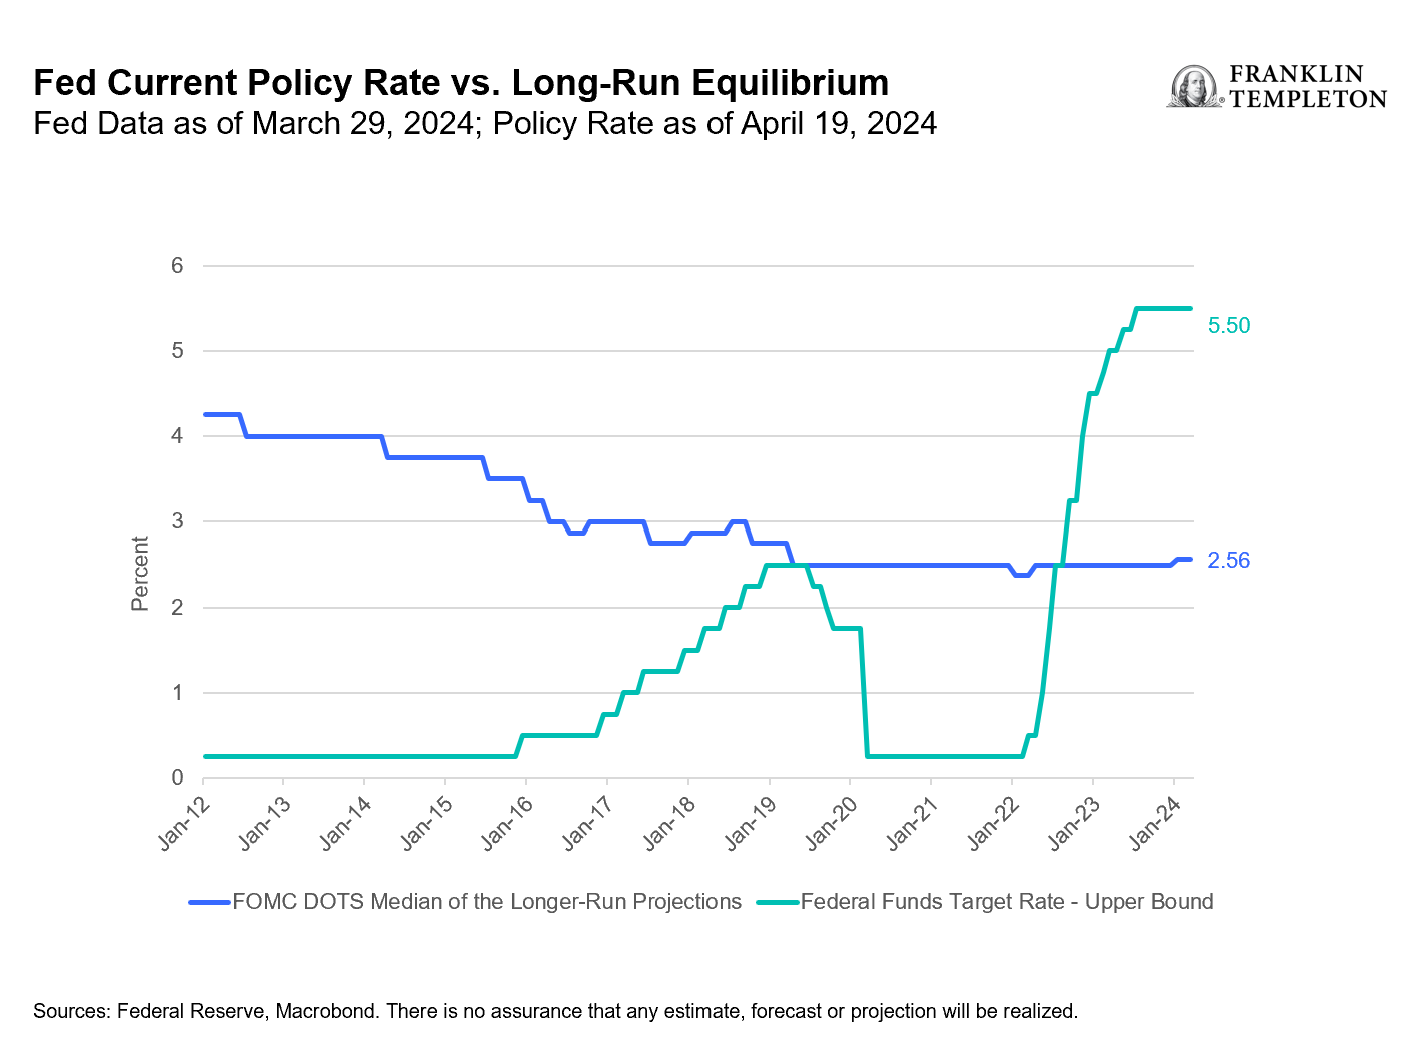
The macro backdrop displays some important differences versus history, but what about the policy backdrop? Although there is a debate among market participants around how restrictive Fed policy currently is, there appears to be consensus in the Fed’s interest-rate projections (known as the “dot plot”) that the FOMC views current policy levels as restrictive (Exhibit 2).1
Exhibit 2: Fed Current Policy Rate vs. Long-Run Equilibrium (right click on chart to enlarge)
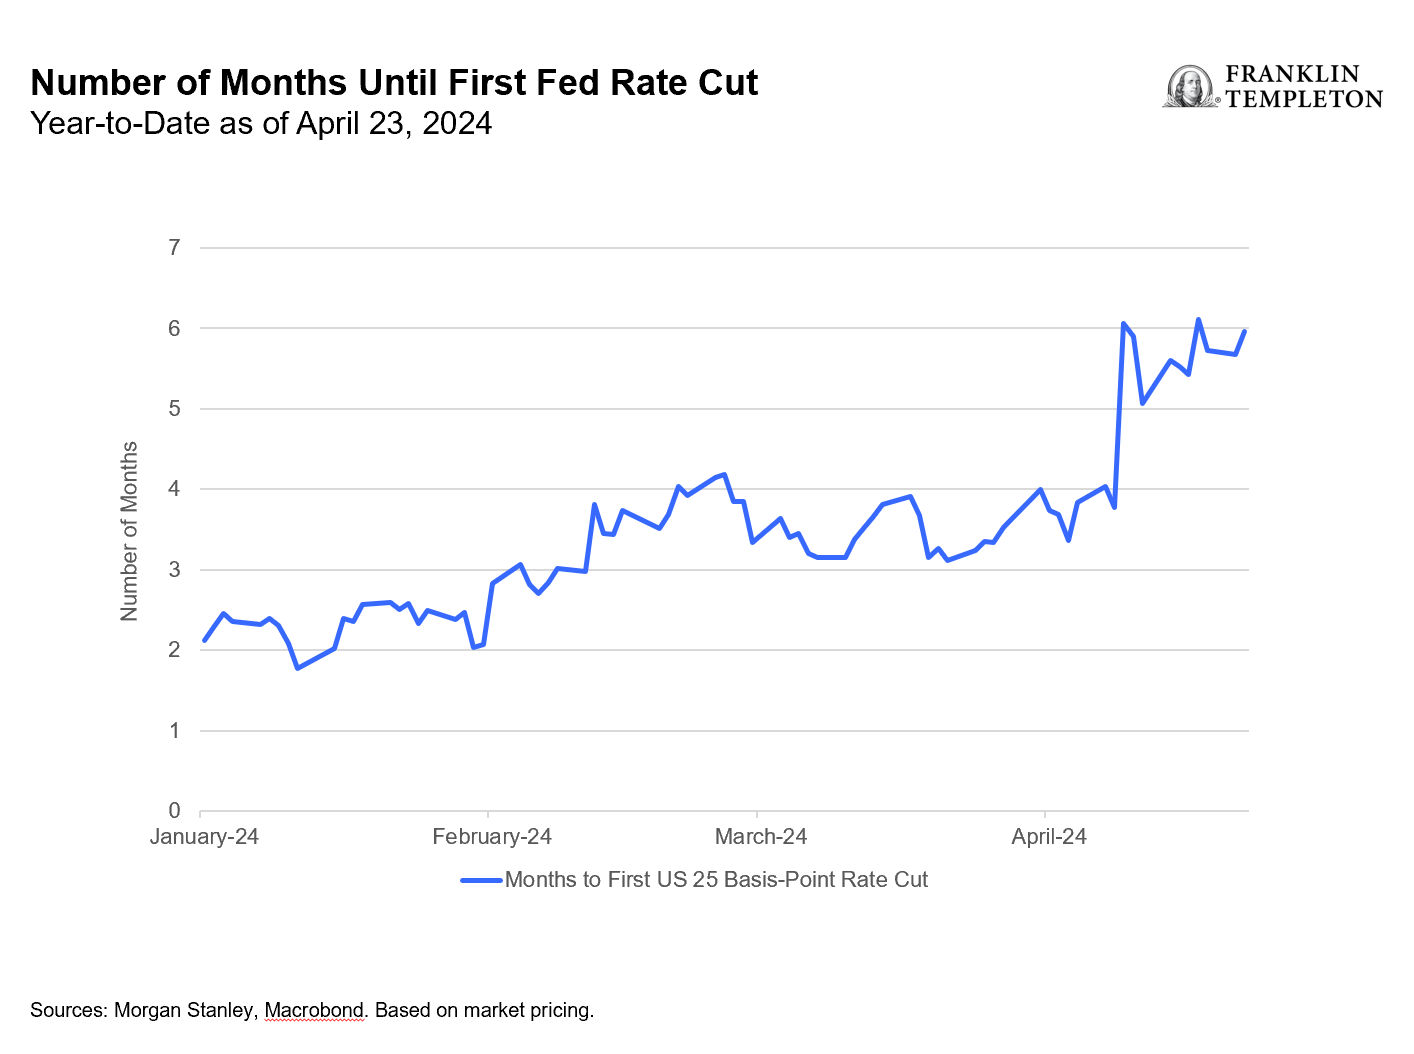
Importantly, market pricing has focused on when Fed rate cuts would begin, rather than if they will begin (Exhibit 3). The expected timing of the first rate cut has increasingly been delayed, although broad market pricing still expects the Fed to begin its easing cycle this year. Our view aligns with the market here—we think Fed policy rates have reached their peak for this cycle.
Exhibit 3: Number of Months Until First Fed Rate Cut (right click on chart to enlarge)
Asset-allocation implications
If we are at peak rates, what does the current macro context mean for asset allocators?
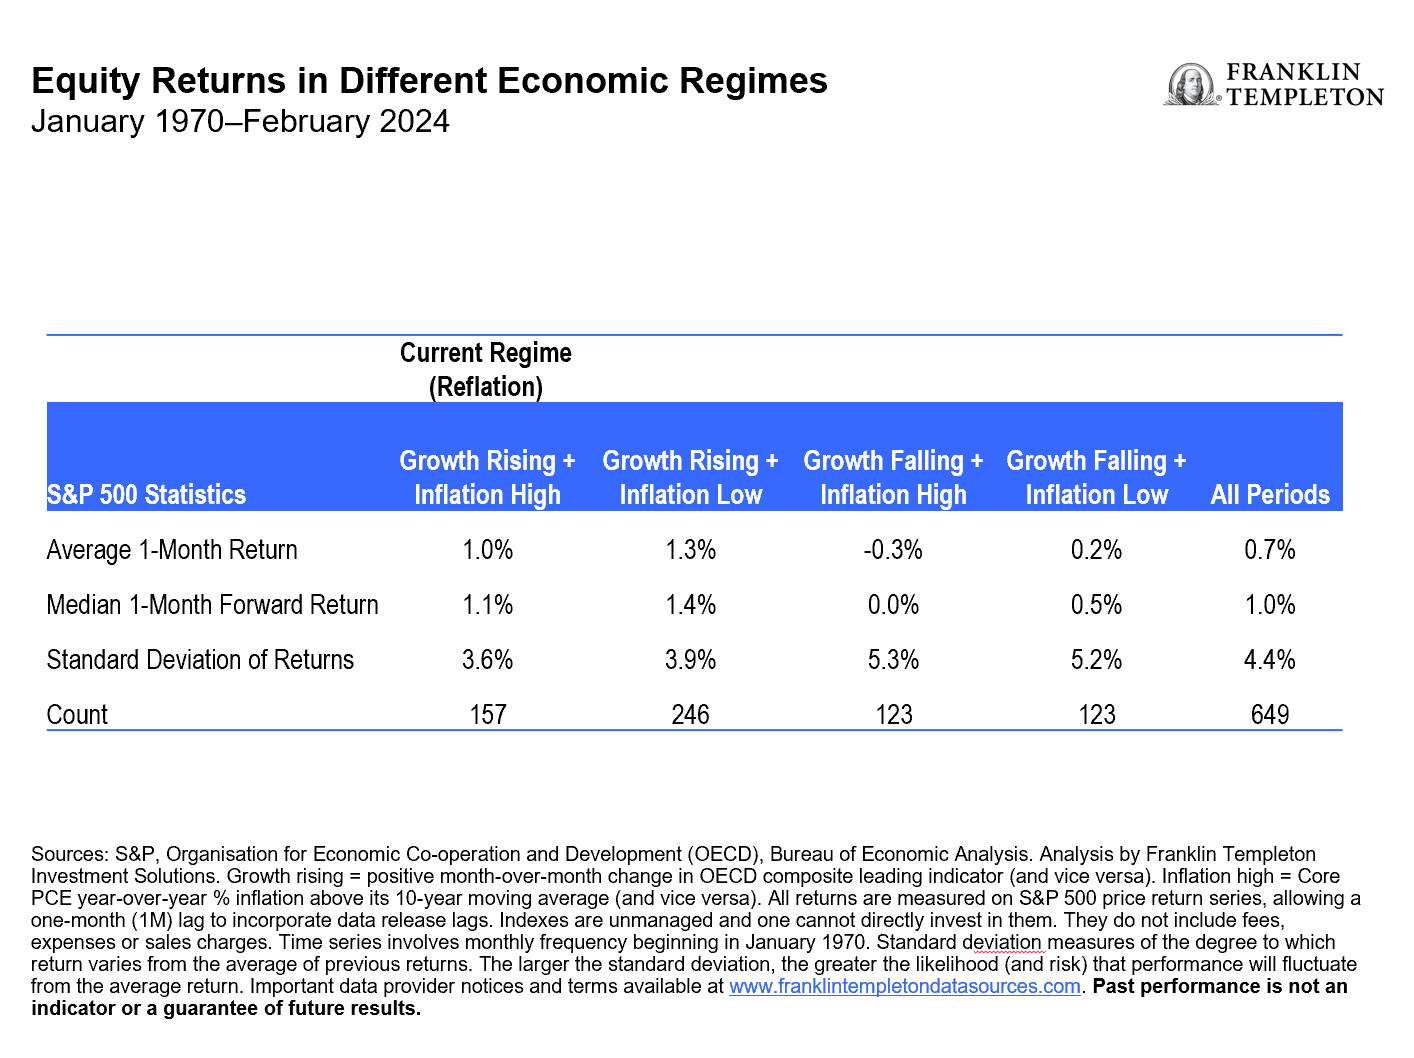
Let’s start with the macro differences. It’s atypical to have reflation—which we define as rising growth and above-average inflation—ahead of Fed rate cuts. If we continue to have reflation, is this a negative backdrop for multi-asset portfolios? Our analysis suggests that it is not. In fact, reflation has been a positive regime for equities, where returns have been positive and slightly above their long-run average (Exhibit 4).
Exhibit 4: Equity Returns in Different Economic Regimes (right click on chart to enlarge)
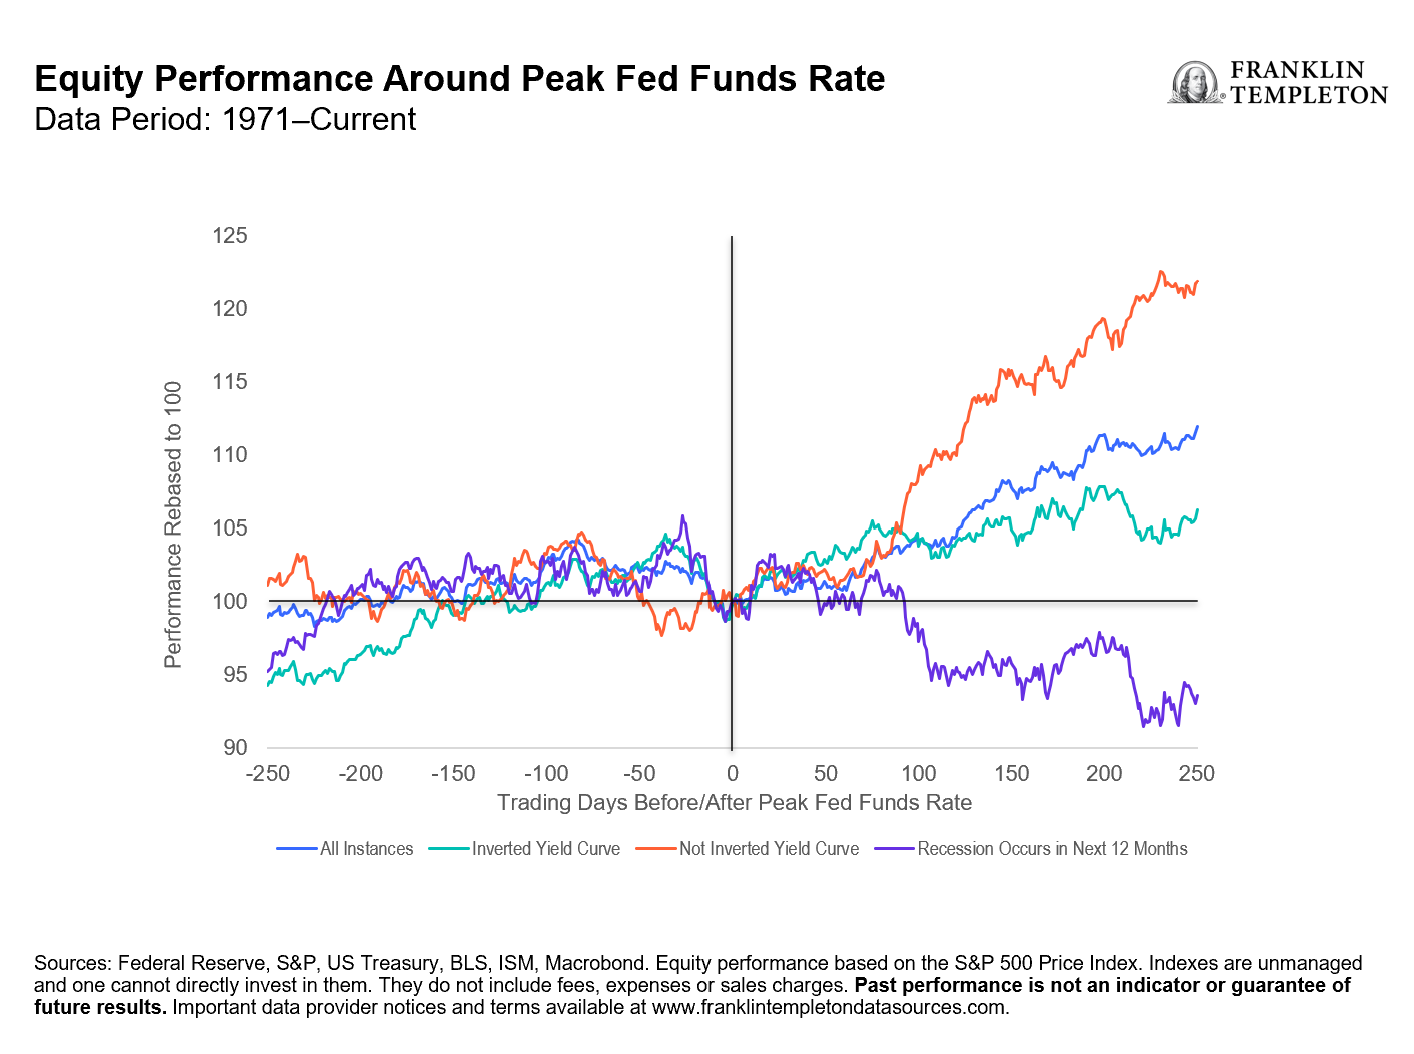
We also analyze how equities behave following a peak in the fed funds rate (Exhibit 5). We acknowledge the timing of a Fed cut is uncertain, so we focus on equity performance following a peak in the fed funds rate. It turns out that equities have tended to perform well, provided a recession is avoided. For now, with US nonfarm payroll growth averaging 244,000 per month over the last year (and rising), we feel that recession risks remain low.
Exhibit 5: Equity Performance Around Peak Fed Funds Rate (right click on chart to enlarge)
Putting it all together leads us to think of the old adage, “history doesn’t repeat itself, but it often rhymes.” We feel this historical analysis has provided a decent guide for how to navigate the current environment. It is understandable that delayed Fed rate cuts have caused some market volatility, especially after equity markets rose 25.1% trough-to-peak in approximately five months.2 Nonetheless, we believe a reflationary macro environment is nothing to fear. In fact, it has historically been a supportive environment for risk-taking in multi-asset portfolios.
Our analysis also plays an important role in how we assess the current Fed rate cycle. While there is a healthy debate around the timing of the Fed easing cycle, we worry less about the delay of Fed rate cuts provided the economy remains strong. Policy is always intended to balance the macro economy, and that’s what we believe is currently taking place. Overall, we continue to remain constructive in our portfolios, with a slight preference for equities versus fixed income.
*****
WHAT ARE THE RISKS?
All investments involve risks, including possible loss of principal.
Equity securities are subject to price fluctuation and possible loss of principal.
Fixed income securities involve interest rate, credit, inflation and reinvestment risks, and possible loss of principal. As interest rates rise, the value of fixed income securities falls.
IMPORTANT LEGAL INFORMATION
This material is intended to be of general interest only and should not be construed as individual investment advice or a recommendation or solicitation to buy, sell or hold any security or to adopt any investment strategy. It does not constitute legal or tax advice. This material may not be reproduced, distributed or published without prior written permission from Franklin Templeton.
The views expressed are those of the investment manager and the comments, opinions and analyses are rendered as at publication date and may change without notice. The underlying assumptions and these views are subject to change based on market and other conditions and may differ from other portfolio managers or of the firm as a whole. The information provided in this material is not intended as a complete analysis of every material fact regarding any country, region or market. There is no assurance that any prediction, projection or forecast on the economy, stock market, bond market or the economic trends of the markets will be realized. The value of investments and the income from them can go down as well as up and you may not get back the full amount that you invested. Past performance is not necessarily indicative nor a guarantee of future performance. All investments involve risks, including possible loss of principal.
Any research and analysis contained in this material has been procured by Franklin Templeton for its own purposes and may be acted upon in that connection and, as such, is provided to you incidentally. Data from third party sources may have been used in the preparation of this material and Franklin Templeton (“FT”) has not independently verified, validated or audited such data. Although information has been obtained from sources that Franklin Templeton believes to be reliable, no guarantee can be given as to its accuracy and such information may be incomplete or condensed and may be subject to change at any time without notice. The mention of any individual securities should neither constitute nor be construed as a recommendation to purchase, hold or sell any securities, and the information provided regarding such individual securities (if any) is not a sufficient basis upon which to make an investment decision. FT accepts no liability whatsoever for any loss arising from use of this information and reliance upon the comments, opinions and analyses in the material is at the sole discretion of the user.
Products, services and information may not be available in all jurisdictions and are offered outside the U.S. by other FT affiliates and/or their distributors as local laws and regulation permits. Please consult your own financial professional or Franklin Templeton institutional contact for further information on availability of products and services in your jurisdiction.
Please visit www.franklinresources.com to be directed to your local Franklin Templeton website.
CFA® and Chartered Financial Analyst® are trademarks owned by CFA Institute.
__________
1. Source: Federal Reserve Board of Governors, Summary of Economic Projections (SEP). According to the SEP: The Fed’s dot plot (DOTs) includes “an individual participant’s judgment of the midpoint of the appropriate target range for the federal funds rate or the appropriate target level for the federal funds rate at the end of the specified calendar year or over the longer run. One participant did not submit longer run projections for the federal funds rate.”
2. Sources: Bloomberg, MSCI. MSCI All Country World Net Total Return USD Index from October 27, 2023, to March 21, 2024. The MSCI All Country World Net Total Return Index is a free float-adjusted, market capitalization-weighted index designed to measure the equity market performance of global developed and emerging markets, including income net of tax withholding when dividends are paid, and expressed in US dollars. Indexes are unmanaged and one cannot directly invest in them. They do not include fees, expenses or sales charges. Past performance is not an indicator of future results.