by Shawn Keegan and Salima Lamdouar, Portfolio Managers – Credit, AllianceBernstein
Transitioning to a net-zero carbon economy* is vitally important, and to support that journey sustainable investors should monitor the carbon impact of the corporate bonds in their portfolios. But there’s a lot more to understanding a bond portfolio’s carbon footprint than conventional metrics can show.
Climate transition is a huge area of focus for investors. And corporate bonds will play a critical role in the journey to a net-zero carbon economy.
Start with Simple Metrics
Initially, investors need simple straightforward reporting that can help them grasp how their portfolios are impacting the climate. In response, a number of providers, including MSCI, have created a range of carbon footprint metrics that compare a portfolio’s carbon characteristics with a benchmark.
For bond investors, the most relevant metric is the weighted average carbon intensity of a portfolio. This measures the portfolio’s carbon footprint in terms of the volume of carbon dioxide emissions per value of sales (tons CO2e /US$ mil.).
The metric has several benefits: it’s applicable across asset classes, is simple to calculate, doesn’t need the market cap or sales data required for other (equity ownership-related) measures, and it can be expressed in two numbers—a score for the portfolio and a score for the benchmark.
Understand the Limitations
But inevitably a metric that is so simple and concise has some constraints. For one, it is only a snapshot at a point in time. That means it cannot look forward to allow for companies’ carbon-reduction plans. For instance, it penalizes big users of fossil-fuel energy such as utilities, even if they have a well-considered strategy to transition to renewable energy sources.
Secondly, it cannot capture the nuances of carbon use. The GHG Protocol distinguishes between direct (Scope 1) and indirect sources of carbon emissions (Scopes 2 and 3). The distinctions depend on whether a company emits the carbon itself as an intrinsic part of its business (for example, manufacturing), or as a user of energy (heating or cooling), or further up or down the chain (business travel, supply chain and distribution). Providers of conventional climate data and metrics can reliably measure Scope 1 and 2 emissions but are only starting the complex task of factoring in Scope 3.
Lastly, existing carbon intensity reporting tools do not differentiate between carbon footprints from conventional bonds and those from green bonds or other ESG bond structures. These structures raise capital either for specific green projects via a green bond issue, or to support firm-wide carbon-use reduction via key performance indicator (KPI) linked bonds.
In short, the weighted average carbon intensity metric captures basic facts but cannot provide insight into the intentions or responsibility of the companies in a portfolio. And in particular, it makes no allowance for whether companies have committed to specific climate mitigation targets as part of their business strategy.
Recognize that Progress to Net-Zero Carbon Needs Commitment
Bond investors who seek to support the transition to a net zero-carbon economy need deeper insights into the future direction of their portfolio emissions and the intentions of the underlying issuers. After all, a successful transition needs companies to be committed to decarbonize their businesses and to plan well ahead.
We believe that a sustainable bond portfolio should focus on investing in companies with a demonstrable commitment to future carbon reduction and well-considered strategies to achieve their goals.
To support this objective, we developed an analytical approach that can provide more forward-looking information with better insight.
Identify the Key Sustainability Issues
Starting with MSCI data, we disaggregate a portfolio’s weighted average carbon intensity score so that we have visibility at the issuer level. Then, issuer by issuer, we analyze each security, asking two key questions.
First, is the issuing company’s strategy aligned with recognized carbon-reduction targets? To answer this, we draw on independent research from third-party providers to help us verify and assess each company’s forward-looking carbon-reduction plan. While there are potential differences in methodologies among third-party providers, the result is a picture of companies’ degree of alignment with the Paris Agreement: that is, plans and supporting evidence for keeping carbon emissions below a warming level of two degrees Celsius by 2050. We can also see which companies’ carbon reduction strategies are in line with a warming level of two degrees, align with the Paris Pledges, are unaligned with the Paris Agreement or have no suitable disclosures.
Second, how are companies financing their transition to net zero carbon? We think that issuing green bonds—or other ESG bond structures with specific targets—can often be a compelling way for companies to execute their transition plan. For some industries at an earlier stage in their decarbonization journey, it may make sense to issue sustainability-linked bonds. These structures commit companies to decarbonize without regard to external factors and so help to lessen the odds of a change of course. For instance, in the oil and gas industry, an increase in hydrocarbon prices makes further exploration and production more attractive and risks eroding carbon-reduction plans.
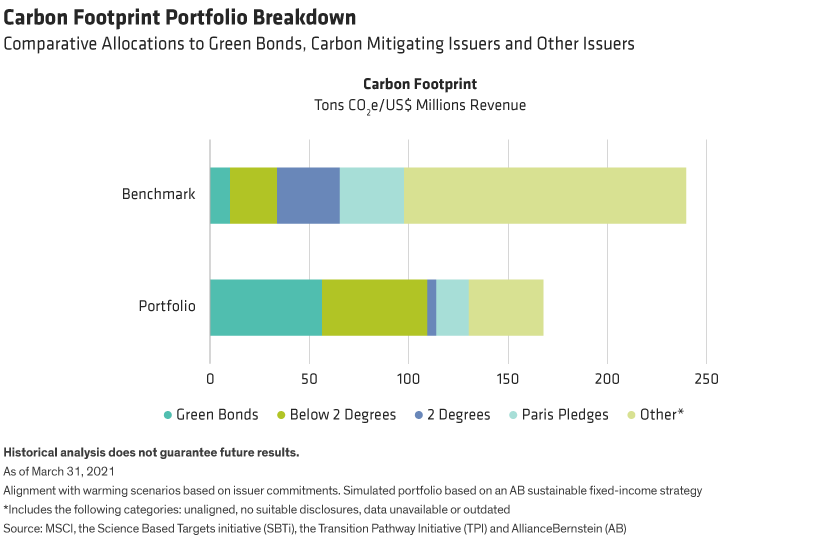
In the Display below, we illustrate the results of this significantly more comprehensive and forward-looking analysis for a sustainable strategy.

In this example, the sustainable portfolio’s weighted average carbon intensity is about two-thirds that of the benchmark. Further, the portfolio includes far more green bonds than the benchmark and has proportionately much greater exposure to companies with specific climate-reduction commitments.
Look at the Wider Picture
Because Scope 3 emissions cover such a wide range of possible sources (and because companies do not calculate or disclose them in a consistent way), it’s hard for conventional metrics to capture the full picture. For example, some issuers in the retail industry refer only to goods’ transport costs as scope 3— without taking account into the broader footprint of their supply chain. But for most industries scope 3 emissions represent the bulk of the carbon footprint and we allow for this when building sustainable portfolios for our clients.
Similarly, it’s important to be aware of carbon “reductions” that merely dismantle the east wall to repair the west wall. A Brazilian auto manufacturer’s plan to switch vehicles from high-emission diesel to ethanol may look like a big win—until we factor in the resulting environmental cost from deforestation in the Amazon basin.
So it’s important to stay aware of the wider picture and continually question whether conventional analysis adequately reflects reality.
Be Clear About the Journey
Investors should be clear about the key milestones as well as the end goal of a company’s carbon-reduction journey. We tend to be skeptical of decarbonization strategies that rely on hypothetical future technology advances or incorporate a large amount of carbon-offset purchases. And we think investors should prefer science-based targets. The International Capital Markets Association Climate Transition Finance Handbook 2020 lays out some useful minimum standards, which will likely be developed further in future editions.
Lastly, we think investors should push for ambitious targets and look for continuous improvement to align with net-zero carbon by 2050. Engagement with companies’ management is key to understanding their progress.
The transition to a net-zero carbon economy is a huge and developing topic. The data, the level of detail, and the science behind carbon reduction are all evolving. Some basic metrics have created a sound platform, but investors will need to stay alert to new insights and be ready to adopt new analyses to better understand their bond portfolios’ carbon footprint.
* A net-zero carbon economy is defined as an economy that aligns with 1.5-degrees Celsius of warming by 2050 as outlined by the Paris Agreement.
Shawn Keegan is Portfolio Manager–Credit at AB.
Salima Lamdouar is Portfolio Manager–Credit at AB.
The views expressed herein do not constitute research, investment advice or trade recommendations and do not necessarily represent the views of all AB portfolio-management teams and are subject to revision over time.
MSCI makes no express or implied warranties or representations and shall have no liability whatsoever with respect to any MSCI data contained herein.
This post was first published at the official blog of AllianceBernstein.
Copyright © AllianceBernstein


