


by Blaine Rollins, CFA, 361 Capital
As the VIX flirts with single digits, the S&P 500 has been flopping around like a live fish on deck. But for U.S. investors in foreign equities, the music continues to play as cheaper valuations overseas and a weaker U.S. dollar pushed fund flows into other geographies. As you might have guessed, Argentina has led the way with a 40% gain for U.S. investors year to date. But looking more broadly around the world shows nearly half of the major equity markets posting returns that are greater than 13% versus the S&P 500 at 7.8%.
For the week, the returns continued to be concentrated in the overseas markets as France looked certain to pick a Macron victory. Also gaining was the Nasdaq which seems to be in a perfect Goldilocks economic growth environment for its companies (not too hot and not too cold). If the economy was flying, investors would want to own cyclicals. If the economy was sinking, investors would want to own bonds. Instead, with the 2% growth outlook that we seem to be heading toward in the U.S., then Apple, Google and Netflix continue to be the names at the top of everyone’s buy list.
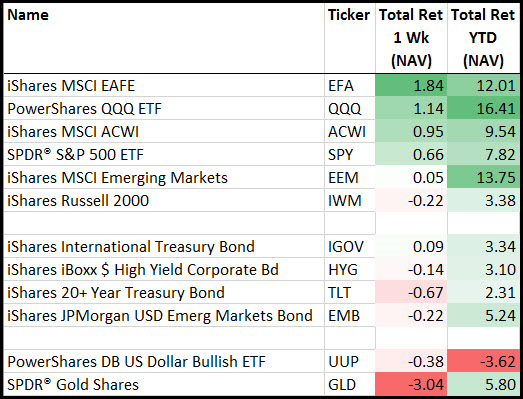
Speaking of International stocks, from the Brexit low, EAFE has now gained +27%…

Looking at all of the major Equity markets shows plenty of places to invest outside of the U.S. in 2017…

Europe has seen a large reversal in fund flows in 2017 which helps to explain the 10-30% gains you see above…

(JP Morgan)
On the flipside, Gold is quickly losing its luster again after an early 2017 recovery…
Big trend-following asset styles will not be a fan of last week’s breakdown. And with North Korea losing all of its friendly nations, major geopolitical risk seems to be taking a backseat in the markets right now.

Apple Inc. leads all equity sectors for the week and the year to date…
It is tough to ignore Apple given that it is now a larger weight than most equity sectors. Credit their good earnings for pulling the Tech sector and Nasdaq to new all-time highs last week.
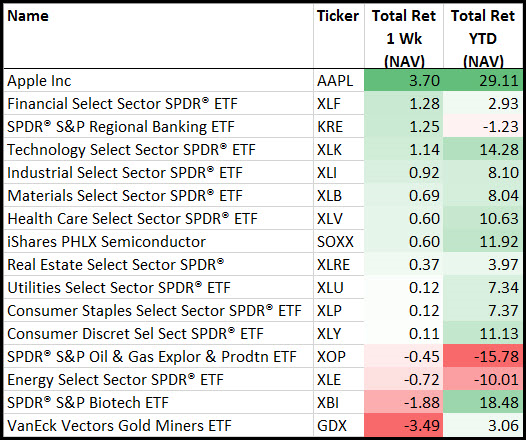
Stocks follow earnings? Or earnings follow stocks?
Technology and Consumer Cyclicals post the best earnings beat rate for the Q1 reporting season. Is it a coincidence that their stocks have been outperforming year to date? Or did the outperforming stocks tip you as to which groups would have the better earnings?

(Earnings via @bespokeinvest)
If you run money, you can’t ignore Apple…
It has outperformed the market by three-fold YTD.
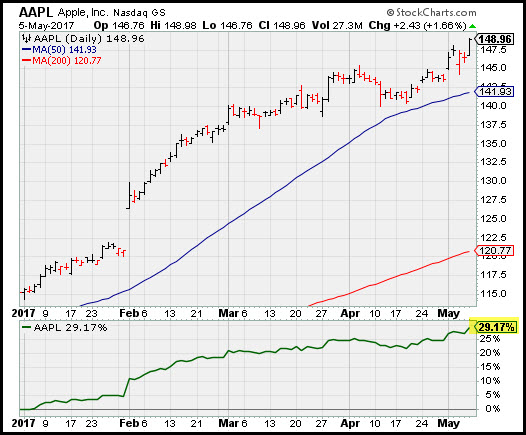
Of course it can only help when the Swiss National Bank is buying 100,000 shares of Apple, every single day…

But not just Apple. Look at this lengthy list of Large Cap ATNH’s from Friday…
@361Capital: Lg Cap All-Time Highs jumps to 81 stocks. Tech, ConsDiscr, Industrials & Fins lead. $XLK $XLY $XLI $XLF pic.twitter.com/7Q0P7lvZ3j

The comments from the FOMC meeting last week took the odds of a June rate hike to a near certainty…

(Financial Times)
Friday’s jobs report details helps to explain why a favorite Denver family Italian restaurant had a third of its tables closed on a busy Sunday night…wait staff and kitchen shortage!
@NickTimiraos: 78.6% of 25-54 year-olds were working in April. Postcrisis gap is around two-thirds of the way back to normal

But it does look like Apartment supply is beginning to catch up to demand…
And we are now seeing $500 referral rewards in the Denver market that were not there a year ago.

(@MrMarkHanson)
Hard data alert last week: U.S. auto sales remain stuck in third gear…
Auto makers signaled their hot streak in the U.S. is rapidly cooling, as demand last month turned surprisingly sluggish for the trucks and SUVs that have fueled record profits for domestic players.
General Motors Co. and Ford Motor Co. on Tuesday reported declines in April of 5.8% and 7.1%, respectively, compared with the same month last year. Fiat Chrysler Automobiles NV reported a 7% decline, as sales at its Jeep brand continued to tumble.
Another troubling sign: It is taking dealers far longer to sell off inventory, resulting in a glut of unsold cars and trucks. GM, the No. 1 U.S. auto maker, has nearly 1 million vehicles sitting on dealer lots.
Overall, auto makers sold 1.43 million vehicles in the U.S. in April, down 4.7% from a year earlier, according to Autodata Corp.
(WSJ)

U.S. economic surprises continue to disappoint. The S&P 500 continues to ignore…
US CESI rolled over sharply recently and is now in negative territory. We note that the weakness was partly due to the CPI miss last month, which could be a one-off, but most recently the US manufacturing datapoints have weakened, as well. If the strong correlation between S&P500 and CESI holds, stocks could see almost 10%+ downside.
(JPMorgan)

Ned Davis Research looks like they also would prefer to own the Nasdaq over the S&P 500…

Good news for oil analysts is that they won’t have to try and value the Aramco energy reserves…
Saudi Arabia’s giant oil and gas reserves and any decisions about producing from them will remain solely in government hands after Saudi Aramco’s initial public offering, Deputy Crown Prince Mohammed bin Salman said on state television.
The world’s largest oil exporter known formally as Saudi Arabian Oil Co. holds a concession to pump the kingdom’s oil and gas, and a stake in that business is what the government will sell in an offering of “not far from 5 percent” of company shares in 2018, the prince said Tuesday in a TV interview. Analysts at Sanford C. Bernstein & Co. and Rystad Energy AS said in March that the IPO has a potential market value of more than $1 trillion.
“The wells will still be owned by the government,” said Prince Mohammed, the son of King Salman bin Abdulaziz. “The company only has the right to benefit from the wells. This is the same as before, and there are no changes to that.”
About those oil prices…

One note of caution for energy companies…
The slowdown in oil-producer bankruptcies is a sign higher crude prices and relentless cost-cutting have eased the financial pressure on companies. But this week, U.S. oil prices fell below $46 a barrel, putting the industry on edge again.
“Maybe the storm has not passed,” said Charles Beckham, a partner at Haynes & Boone. Beckham said he wouldn’t be surprised to see another wave of bankruptcies if oil prices don’t quickly recover back into the $50 a barrel range.
“The patience of their lenders could evaporate,” he said.
(Fuelfix)
Seems like the credit markets are completely ignoring $40 oil prices…

(@jsblokland)
And the junk bond markets remain in bull market mode…

But another reason to keep your credit radar on high and shields up…
“It’s a really good time to be an issuer,” said Andrew Whittaker, vice chairman of investment bank Jefferies. The flip side is it is not such a good time to be a lender or an owner of bonds and loans.
U.S. companies have taken on an extra $7.8 trillion of debt and other liabilities since 2010, according to the International Monetary Fund. Strip out the boom-to-bust energy sector and median corporate leverage is the highest since at least 1980.
But the signs that the credit markets may be starting to get carried away are more in the structure of the deals than in the total amount lent. Not only are companies able to sell debt with very low yields, they are dictating the terms. Companies have extended the maturities of their bonds and loans, adding to their riskiness, even as the yields come down.
Investors are willing to lend against looser and looser definitions of operating profits, and lend more. Protective covenants have all but disappeared from the loan market, removing what was once regarded as a vital protection for investors. And there is anecdotal evidence of hedge funds not usually present in the market buying in, suggesting less informed investors are getting involved—perhaps drawn by the 24% return on U.S. junk bonds since the oil panic began to recede in February last year.
(WSJ)
And just a quick glance of this chart shows you that credit outperformance appears to happen in two year cycles…

(@DriehausCapital)
Paul Singer raised $5b in 24 hours. He is now hoping for a quick buying opportunity…
More than eight years of monetary stimulus has created a world of manipulated prices, Singer told clients.
“Markets may be in a situation somewhat akin to a coiled spring,” the firm wrote. “We don’t know exactly what factor, event or combination of actions could release the possible pent-up revaluation of markets, but we think that there has never been a larger (and more undeserved) spirit of financial market complacency in our experience.”
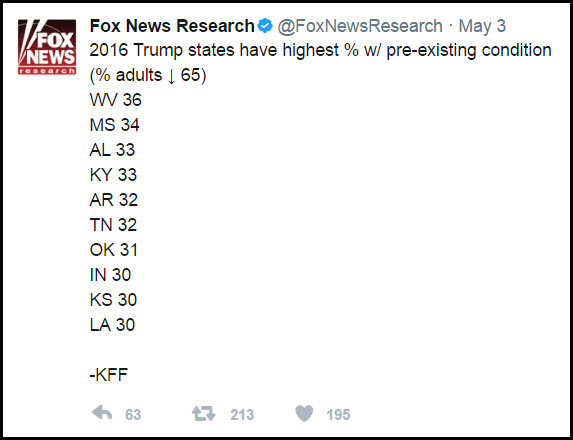
As the Senate moves towards the health care plan and the issue of pre-existing conditions, it will be interesting to watch them try and pull such a valuable entitlement away from millions…
Finally, the relative professional athlete salary…
It’s common knowledge that professional athletes earn extraordinary incomes. What is less known or understood is how the advent of these riches has seeped into the conscious and unconscious ways in which our society now parents children.
I looked first look at the evolution of the prize. A comparison of the average professional baseball salary to the national average salary over the last one hundred years shows that for the first fifty years, 1920–1970, baseball players held a steady multiple of about 3.4 times the national average income.
As television contracts, merchandising and other sources injected billions into the sport, and as players organized to get their share, salaries exploded. The multiple rapidly climbed from 3.4 times the national average in 1970 to 78 times the national average by 2015.
(Time)

Instead, I’ll just stick to running. I have a new goal…
@darrenrovell: Eliud Kipchoge runs fastest marathon in history (2 hours, 24 seconds)

Copyright © 361 Capital