by Don Vialoux, Timingthemarket.ca
Jon Vialoux is scheduled to appear on BNN’s Market Call Tonight at 6:00 PM EDT
Pre-opening Comments for Friday June 3rd
U. S. equity index futures were lower this morning. S&P 500 futures were down 12 points in pre-opening trade.
Index futures moved lower following release of the May economic data. Consensus for May Non-farm payrolls was 162,000 versus a downwardly revised 123,000 in April. Actual was 38,000, the weakest gain in over 6 years. Consensus for the May unemployment rate was unchanged at 5.0% versus 5.0% in April. Actual was a drop to 4.7%. Consensus for May Hourly Earnings was an increase of 0.2% versus a gain of 0.3% in April. Actual was an increase of 0.2%. Consensus for April Trade Deficit was a increase to $41.6 billion versus $40.4 billion in March. Actual was a drop to $37.4 billion.
The Canadian Dollar gained US 0.76 to 77.07 cents following release of Canada’s April Merchandise Deficit report. Consensus was a deficit of $2.6 billion versus $3.4 billion in March. Actual was a deficit of $2.94 billion.
Avon Products added $0.10 to $4.11 after Jefferies initiated coverage with a Buy rating and a target of $7.
EquityClock’s Daily Market Comment
Following is a link:
http://www.equityclock.com/2016/06/02/stock-market-outlook-for-june-3-2016/
Note seasonality charts on Non-farm Payrolls and Crude Oil Days of Supply
Mark Leibovit Comment
Following is a link:
For those who missed my eSignal webinar yesterday, here is the link:
https://www.youtube.com/watch?v=MXGWxMpobCc
Observations
Interesting close by U.S. equity markets yesterday! Several stock market indices and ETFs closed at or above key technical levels just prior to an important economic report this morning, the May employment report. Consensus is that Non-farm payrolls will slip to 160,000 from 171,000 in April. However, the ADP report released yesterday suggests that consensus probably is too low. The Fed will be watching May Hourly earnings closely. They have been creeping up recently and the Fed is starting to show concern about wage inflation. Consensus calls for another increase of 0.2% in May versus a gain of 0.3% in April
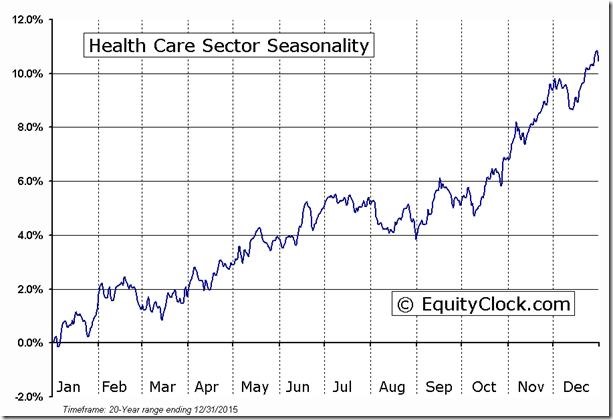
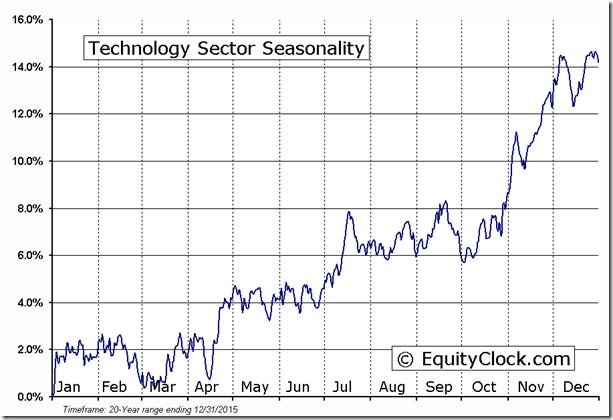
Two sectors were notable winners on the charts yesterday, health care (including biotech) and technology. Both currently are in a period of seasonal strength lasting until at least mid-July.
Interesting Charts
A strong close by U.S. equity indices triggered several technical events:
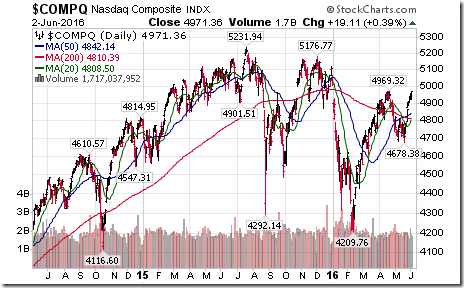
The NASDAQ Composite Index moved above resistance at 4,969.32 to extend an intermediate uptrend.
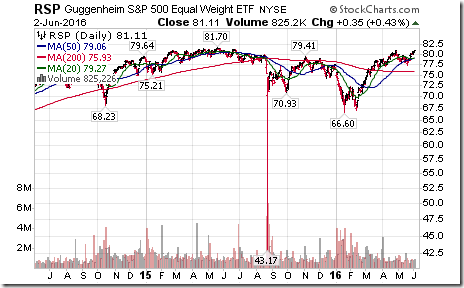
The equally weighted S&P 500 ETF moved above resistance at $81.11 to reach a 10 month high.
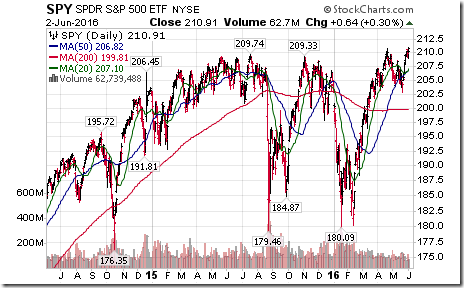
S&P 500 SPDRs touched an all-time high at 210.93.
StockTwits Released Yesterday
S&P 500 Index tests resistance as Russell 2000 breaks out to a new 2016 high.
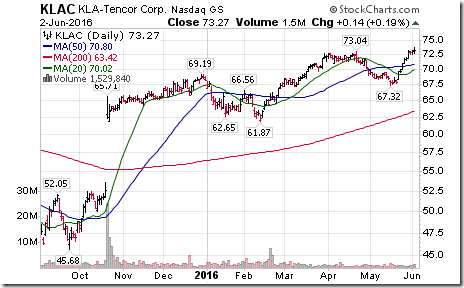
Technical action by S&P 500 stocks to Noon: Bullish. Breakouts: $RL, $ABBV, $AET, $CAH, $ESRX, $HUM, $UNH, $WAT, $RTN, $FISV, $KLAC, $LRCX
Editor’s Note: After Noon, another five S&P 500 stocks broke above resistance: FITB, JNJ, GLW, ROK and FB. No stocks broke support
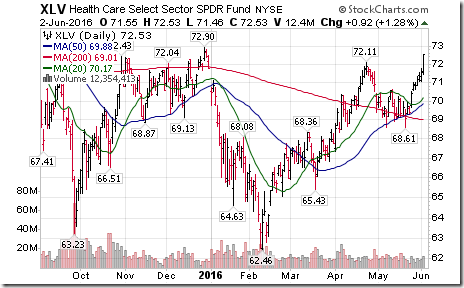
Today’s breakouts dominated by Health Care. $XLV broke above $72.11 extending intermediate uptrend. ‘Tis the season!
Semiconductor oriented technology stocks, $FISV, $KLAC, $LRCX breaking above resistance extending intermediate uptrends.
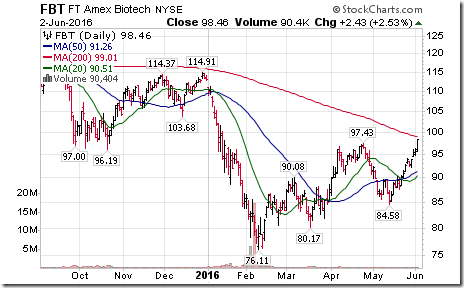
Nice breakout by First Trust Biotech ETF $FBT above resistance at $97.43 to extend intermediate uptrend. ‘Tis the season!
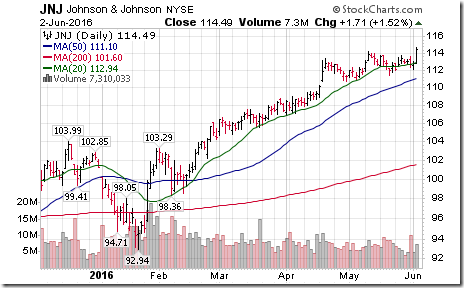
Nice breakout by $JNJ above $114.18 to reach an all-time high! ‘Tis the season for strength until at least mid-July!
Trader’s Corner
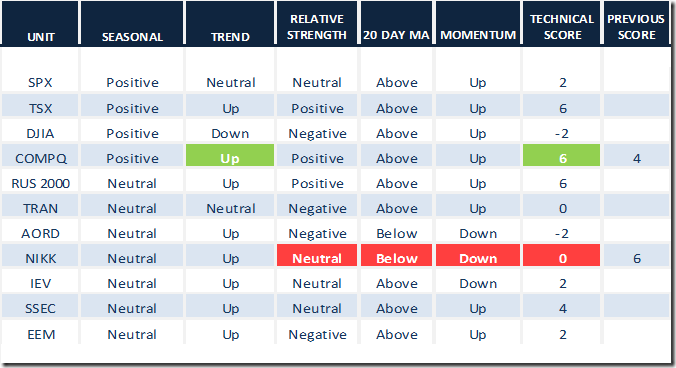
Daily Seasonal/Technical Equity Trends for June 2nd 2016
Green: Increase from previous day
Red: Decrease from previous day
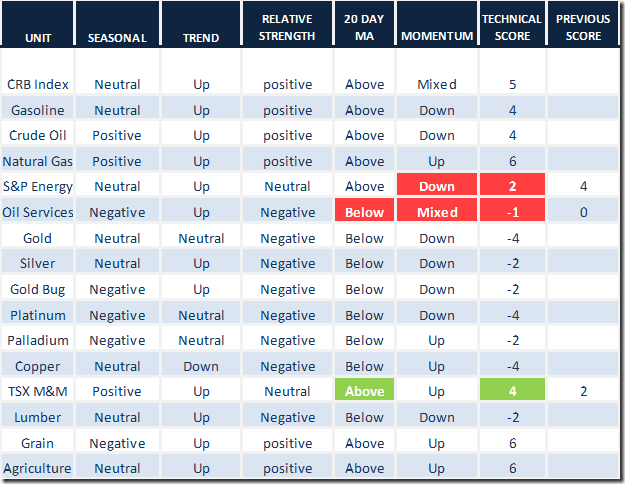
Daily Seasonal/Technical Commodities Trends for June 2nd 2016
Green: Increase from previous day
Red: Decrease from previous day
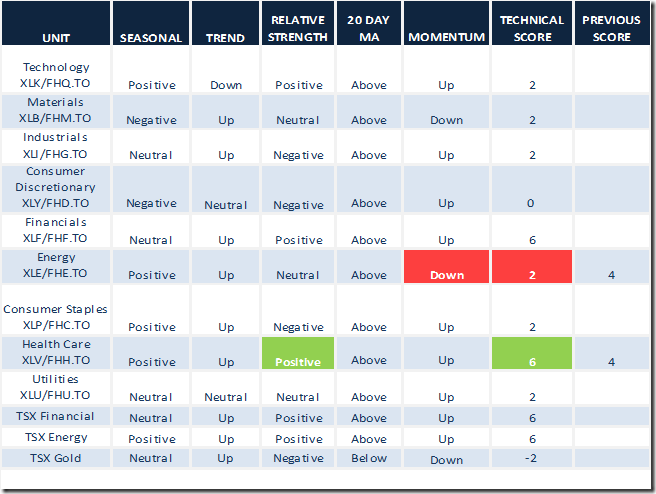
Daily Seasonal/Technical Sector Trends for March June 2nd 2016
Green: Increase from previous day
Red: Decrease from previous day
Special Free Services available through www.equityclock.com
Equityclock.com is offering free access to a data base showing seasonal studies on individual stocks and sectors. The data base holds seasonality studies on over 1000 big and moderate cap securities and indices. To login, simply go to http://www.equityclock.com/charts/ Following are examples:
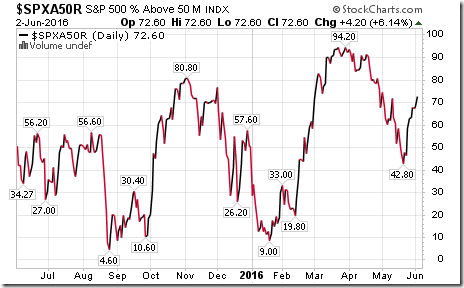
S&P 500 Momentum Barometer
The Barometer added 4.20 to 72.60 yesterday. The Barometer has returned to an intermediate overbought, but has yet to show signs of a short term peak.
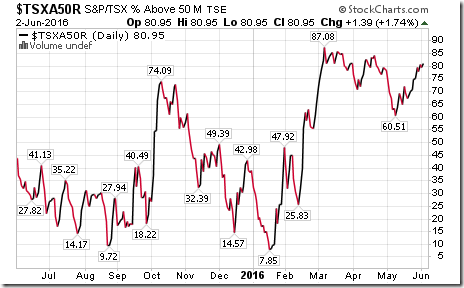
TSX Composite Momentum Barometer
The Barometer added 1.39 to 80.95. The Barometer remains intermediate overbought, but has yet to show signs of a short term peak.
Disclaimer: Seasonality and technical ratings offered in this report by www.timingthemarket.ca and www.equityclock.com are for information only. They should not be considered as advice to purchase or to sell mentioned securities. Data offered in this report is believed to be accurate, but is not guaranteed
Copyright © DV Tech Talk, Timingthemarket.ca


