


Bond Market Malformation, Trouble Ahead?
by J.R. Rieger, Managing Director and Global Head of Fixed Income, S&P Dow Jones Indices
There is no doubt about it the bond markets are malformed due to quantitative easing (QE). The possibility of a Fed change of short term rates in June or July is on the minds of many. Are the investment grade municipal and corporate bond markets primed for a near term correction as a result? Only time will tell.
However, there are factors that would argue against such a proposition:
- A rise in rates is most likely ‘baked in’ to each of these markets.
- The technical imbalance that overhangs both of these markets is supply vs. demand:
- While investment grade corporate bonds were issued in record numbers, that issuance has slowed, demand however has not. That demand is driven by the need for low risk but incremental yield over risk free yields. Please see yield spread chart below of the bonds of the companies in the S&P 500 (the S&P 500 Bond Index is approximately 92% investment grade) vs. the 10 year U.S. Treasury Bond Index.
- Municipal bond issuance has seen periods of increased issuance as well as relative ‘dry spells’. The net effect is new issue supply remains below historical norms. Demand for quality tax-exempt bonds remains firm yet still historically cheap relative to U.S. Treasury bond yields.
- While setting record highs, the equity markets have also seen periods of high volatility. The lower volatility seen in the investment grade corporate and municipal bond markets may continue to be seen as a value proposition for risk averse or ‘risk off’ investor mind sets. The volatility and risk adjusted returns for the S&P 500, S&P 500 Bond Index and the S&P Municipal Bond Index for 3, 5 and 10 year periods ending May 2016 can be seen in the table below.
For a discussion on the U.S. Treasury bond market there is a good read in the recent article “I wouldn’t buy a bond with your money” by Jared Dillian at Mauldin Economics which is focused on the U.S. Treasury bond market, particularly the 10 year bond.
Chart 1: Select indices and their yields (Yield to worst):
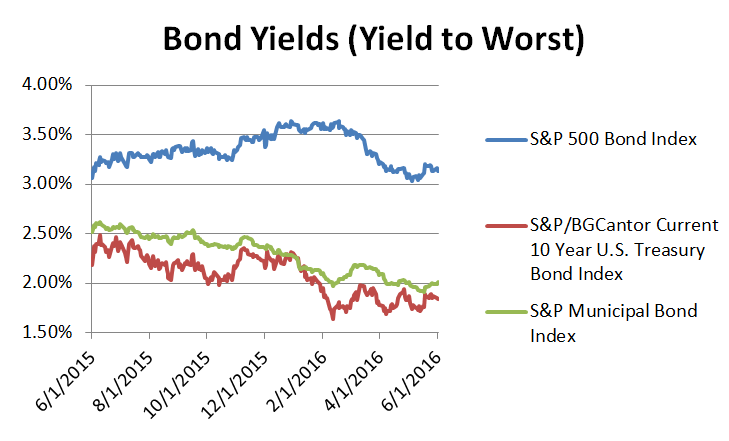
Source: S&P Dow Jones Indices, LLC. Data as of June 2, 2016. Chart is provided for illustrative purposes. It is not possible to invest directly in an index. Past performance is no guarantee of future results.
Table 1: Risk and Risk Adjusted Returns of Select Indices as of May 31, 2016:
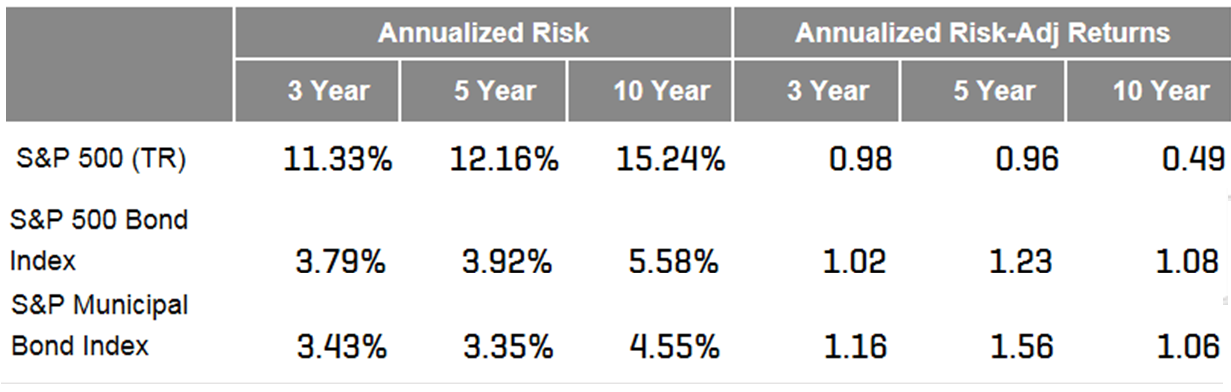
Source: S&P Dow Jones Indices, LLC. Data as of May 31, 2016. Table is provided for illustrative purposes. It is not possible to invest directly in an index. Past performance is no guarantee of future results. Risk is defined as standard deviation calculated based on total returns using monthly values.