Do Strong Returns Follow Strong Returns?
by Michael Batnick, The Irrelevant Investor
Cliff Asness describes momentum as “the phenomenon that securities which have performed well relative to peers (winners) on average continue to outperform, and securities that have performed relatively poorly (losers) tend to continue to underperform.”
Thanks to Asness and others, we know that momentum exists within individual stocks. What I wanted to see is if I could find this anomaly at the index level. Before getting into the details, let me explain the genesis of this analysis before somebody fires a bazooka at my face. I was under the false assumption that strong returns followed strong returns, likewise with lousy returns. I did not set out to disprove momentum (which I’m not), but I want to share what I found in the data. I only used the S&P 500 so this is not meant to be a robust study disproving anything.
Onward.
In the graph below, the gray bar shows the average 12-month returns broken into deciles. The blue bar shows subsequent 12-month returns. You’ll notice that stocks tended to do better following periods of under performance. For instance, the average returns of the worst decile is -29.8% with the next 12 months experiencing an average return of 9.6%. This was the strongest subsequent performance of any decile which means the worst performing 12-month periods experienced the sharpest mean reversion.
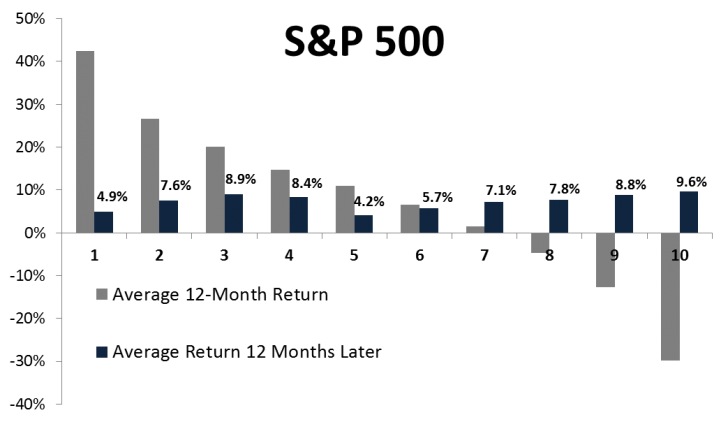
So the previous twelve months tells you nothing about what will happen in the next twelve months (R-Squared of 0.004), but what if we cut it down to a three-month period; maybe momentum only holds over shorter periods of time?
 The average return three months later was pretty strong in the top three deciles, but it was also pretty strong in the weakest decile. It’s hard to say with any conviction that a strong three-month period for stocks will be followed by another strong three-month period, the results seem pretty random.
Below are the likelihood of stocks being higher three and twelve months later. Three months later does show slightly better chances of being positive, but again it’s difficult to draw any strong conclusions.
 I want to make clear that I am a big believer of traditional momentum investing (buying the relative winners and shorting the relative losers). So just because I didn’t find great evidence using three and twelve-month returns for the S&P 500, it doesn’t mean there aren’t simple and effective ways to use “momentum” strategies at the index level (I’m putting momentum in quotes because if momentum refers to relative winners and losers, by definition, momentum at the index level is sort of an oxymoron).
Consider a very simple portfolio (which I am not recommending); it stays invested in the S&P 500 if it is higher than it was twelve months ago and goes to short-term treasuries when it is below.
 As you can see from the slide above, the drawdowns- although not eliminated- were less severe in the momentum strategy. Also, at 9.76% vs 9.94% (I know this is before any transaction costs, taxes, index funds, etc) returns weren’t much worse off.
 Maybe I shouldn’t have been surprised by the data, after all it does make sense to see mean reversion in the indexes. The bottom line is that past returns are absolutely not indicative of future results, especially in the S&P 500.
Copyright © The Irrelevant Investor