
by Brian Levitt, Global Market Strategist, Invesco
Key takeaways
- Too much focus on inflation? - Stocks may benefit whether the economy and/or inflation exceed or underwhelm expectations.
- US debt concerns - Annual deficits will rise but this may not have as big of an impact on the debt-to-GDP ratio as suspected.
- Don't get spooked - Geopolitical conflicts have been a poor predictor of stock prices. Don't be tempted to change your investment plans.
Who knew economic data releases would be the next appointment TV?! My phone’s been blowing up with each nonfarm payroll, retail sales, and Consumer Price Index (CPI) announcement. The “immense” stakes riding on a 10th of a percentage point change in the CPI, for example, seems overblown to me. It’s become “Must See TV,” with investors hyperfocused on making heads or tails of the report. Either may be good for the stock market:
Heads: The economy and/or inflation exceed expectations. The Federal Reserve (Fed) postpones rate cuts, but strong nominal interest rates are good for corporate profits.
Tails: The economy and/or inflation underwhelm expectations. Fed easing is forthcoming.
Don’t get me wrong, there are scenarios that aren’t ideal for stocks. The Fed could have to raise rates. A recession could emerge. Neither is my base case although the Q1 GDP report showing growth slowing and inflation remaining elevated, highlights the risk to the outlook. I’ll keep tuning in, but mostly to see my favorite Wall Street hosts do their things — and to envy the strategists chosen over me. My expectation, irrespective of the economic reports and the ensuing market commentaries, is that I’ll keep putting “my coins” in the stock market.
It may be confirmation bias, but…
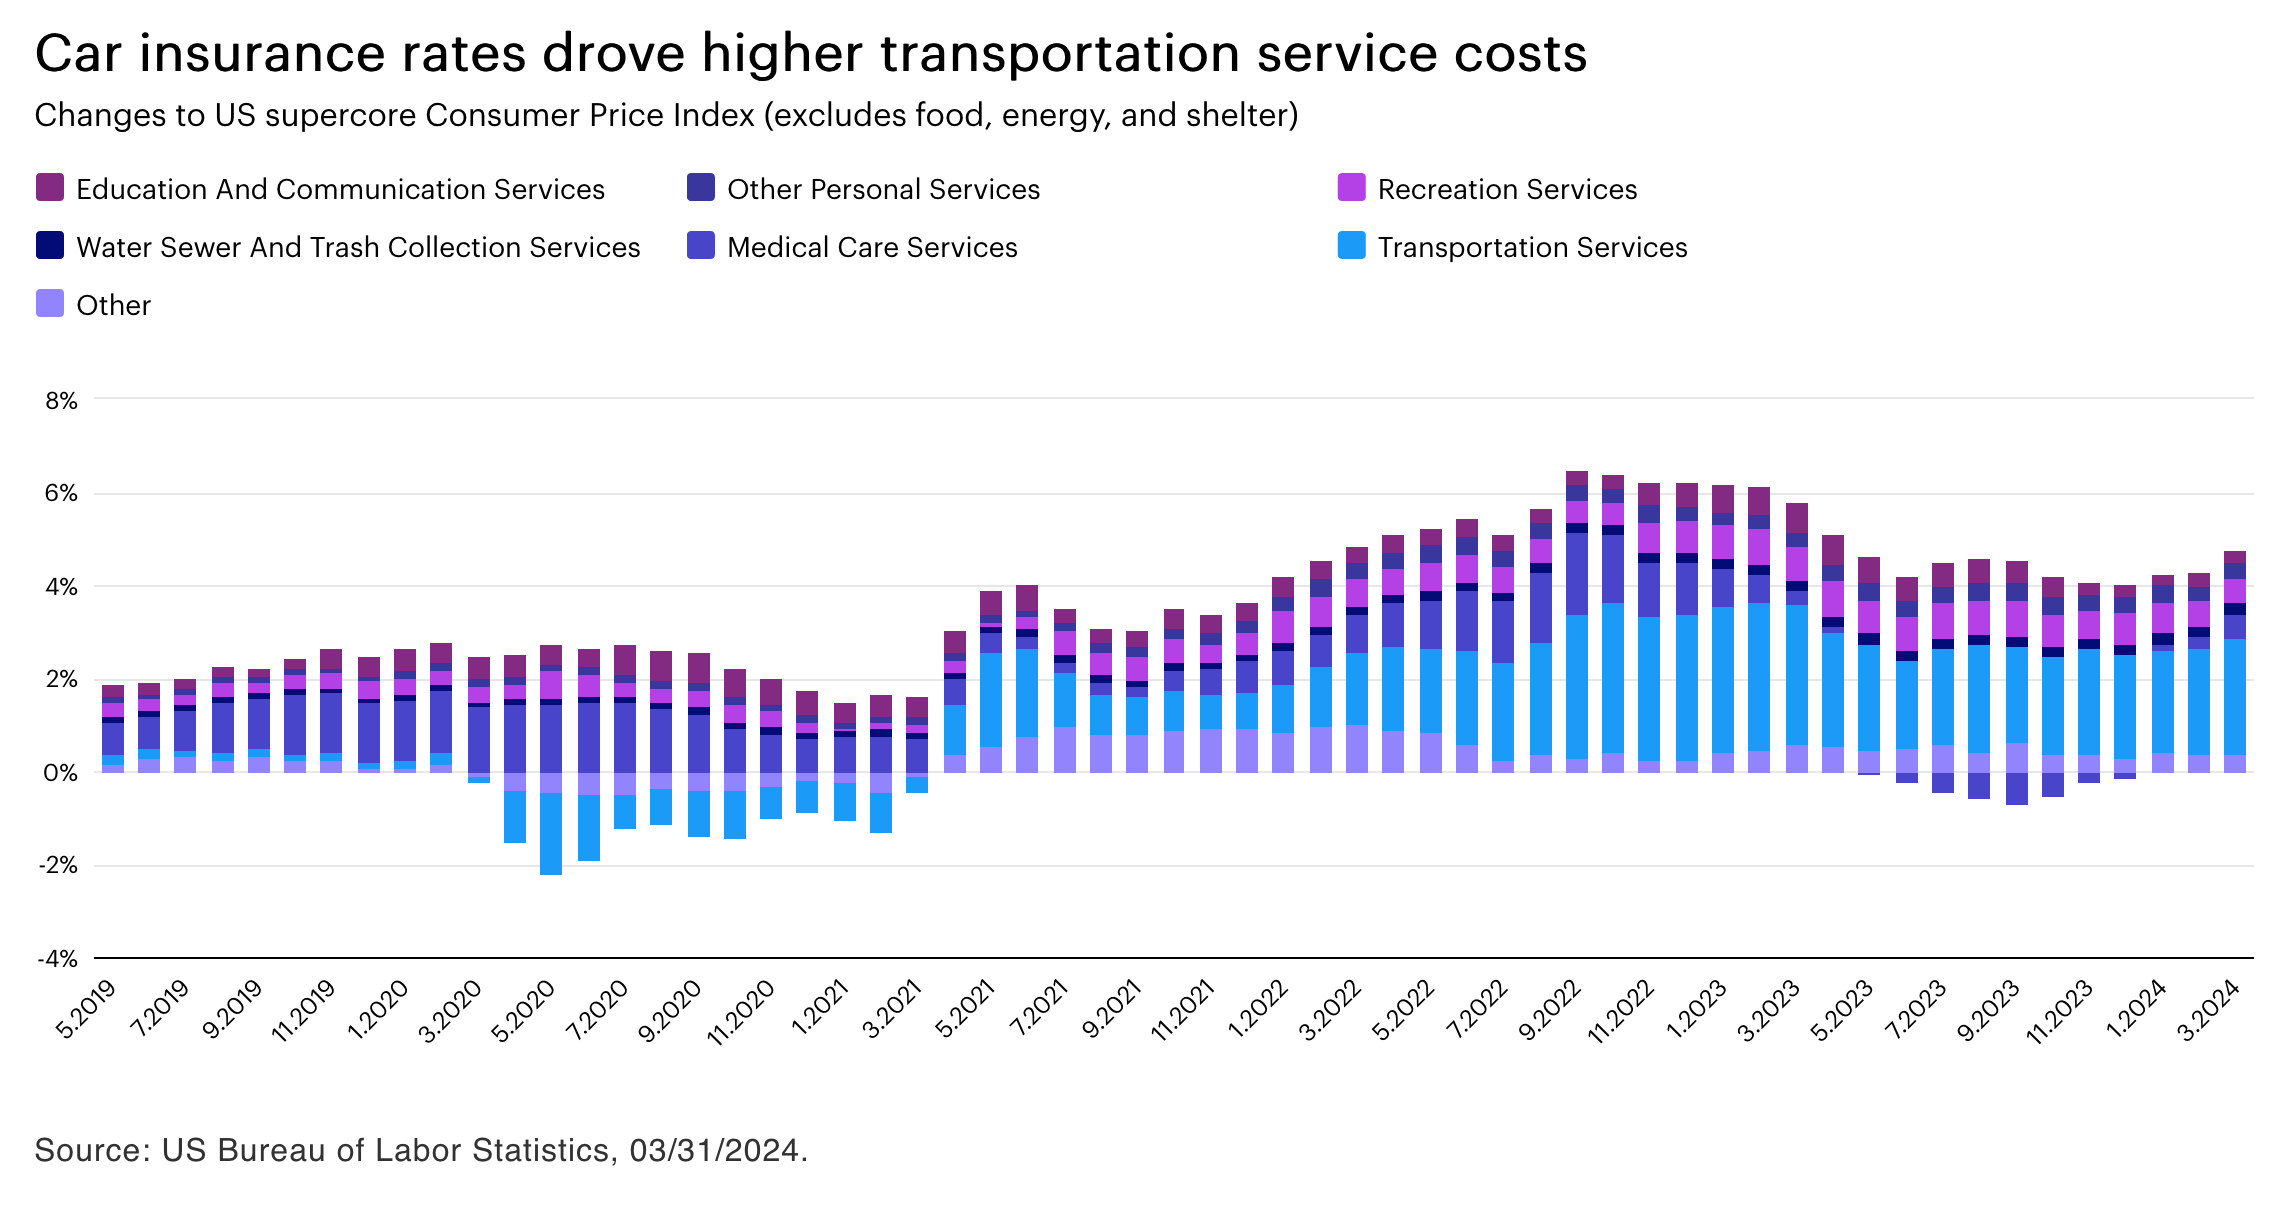
…car insurance rates were the primary culprit behind March’s inflation miss, with the supercore inflation up 4.8%.1 Investors shouldn’t view the CPI report as renewed price instability but rather an unsurprising event in this bizarre COVID-19 cycle. First, car prices went up because of supply-chain challenges.1 Then, part costs and repair fees increased.1 Now, the cost of insuring these higher priced and more technologically advanced vehicles has surged. For all the talk about “sticky” service cost inflation, the transportation services sector (see chart below) is driving half of it.1 It’s highly unlikely that this is something that the Fed will feel the need to suppress. Tightening is behind us.
It was said
“(Geopolitical events as well as US political polarization) may very well be creating risks that could eclipse anything since World War II.”
– Jamie Dimon, Chairman of the Board and Chief Executive Officer, JPMorgan Chase
I worry that these types of comments will spook investors to break from their investment plans. Geopolitical conflict has been a poor predictor of stock prices. Even during the world wars, the Dow Jones Industrial Average posted positive returns.2 More recently, the MSCI Poland Index (US dollars) climbed 39.2% from the day Russia invaded Ukraine (Feb. 24, 2022) through the end of March, outpacing the S&P 500 Index over that period.3 While I’ve never felt comfortable quoting Nathan Rothschild’s “Buy when there is blood in the streets” because it sounds harsh, but it has often been good advice.
Learn more in Military conflicts haven’t derailed the long-term growth of stocks.
Since you asked
Q: Should we be concerned that the US federal government’s interest burden as a percent of the nation’s gross domestic product is rising drastically?
A: The annual deficits will rise, but it may not have as big of an impact on the debt-to-GDP ratio as suspected. Let me explain.
- Yes, long-term interest rates have risen sharply,4 and deficits have widened.5 Compounding the problem, the disharmony in Congress doesn’t inspire confidence that the policymakers do anything to address it.
- The Congressional Budget Office (CBO) expects the US government to run fiscal deficits ranging from a low of $1.5 trillion in 2024 to a high of $2.6 trillion in 2034. It also expects US government borrowing costs to be around 4%, nearly double the interest rate in the 2010s.5
- As a result, the federal interest payment is expected to climb from $659 billion in 2023 to $1.6 trillion in 2034, or from 2.4% of GDP to 3.9% of GDP.5
- If the estimates are correct, there’ll be $13.3 trillion in interest payments made over the next decade.5
- The CBO, however, also expects the US GDP to increase at an annualized rate of 3.9% over the same period, in line with the average interest rate on debt. That would mean $14.3 trillion in additional output.5
- If US nominal growth is in line with or above the government’s average borrowing cost G≥R (growth≥interest rates), then the debt-to-GDP ratio is likely to remain in a tight range. Fortunately, US long rates historically have traded based on the growth potential of the country — not on its perceived creditworthiness.6
Read more about US debt in What is the US national debt’s risk to investments?
Automate my job?
Each month, I pose a question to ChatGPT — the artificial intelligence-driven chatbot — and assess the response.
Q: Which parts of the stock market have tended to perform poorly as interest rates rise?
A: Sectors that typically perform poorly as interest rates rise include interest rate sensitive sectors such as utilities and real estate investment trusts (REITs). Additionally, sectors with high valuations or those with long-duration assets, such as some technology and growth stocks, can also face headwinds as interest rates rise. Overall, investors have tended to favor sectors with lower sensitivity to interest rate changes, such as consumer staples, health care, and certain areas of the financial sector.
Good answer ChatGPT. I’d also add that shorter-term cyclical assets and smaller-capitalization stocks are likely at risk in the very near term when rates drift higher.
I cannot imagine it will be too long until I ask ChatGPT about the asset classes that perform well when rates fall. I don’t believe that we’re too far from the point when rates moderate. It’ll entail investor conviction that the economy and inflation are becoming more subdued, however. At that point, a risk-on trade, such as that experienced in Q4 2023, when cyclical sectors outperformed and small- and mid-cap stocks rallied, could reemerge.7
On the road again
My travels took me to Las Vegas for the Investment Wealth Institute summit. Do I gamble? “Every time I order out,” to quote Lieutenant Frank Drebin of the satirical 1980s TV series Police Squad!. The meeting location gave me the opportunity to open my session by debunking the view held by select investors that the stock market is like a casino. The odds of any casino game are less than 50%, and the longer you play, the more likely you are to lose money. On the other hand, the S&P 500 Index, since 1957, has posted positive returns in 75% of the years and 100% over any 15-year period.8 The longer you stay invested, the more likely you get positive returns. That sounds like the exact opposite of a casino.
See you in May, the gateway to summer!
Footnotes
1 Source: US Bureau of Labor Statistics, 3/31/24.
2 Source: Bloomberg L.P., 3/31/24. The Dow Jones Industrial Average gained 14.9% during WWI (Jul. 28, 1914 to Nov. 11, 1918) and 28.9% during WWII (Sept. 1, 1939 to Sept. 2, 1945). The Dow Jones Industrial Average is a price-weighted average of 30 blue-chip stocks that are generally the leaders in their industry. Indexes cannot be purchased directly by investors. Past performance does not guarantee future results.
3 Source: Bloomberg L.P., 3/31/24. The MSCI Poland Index is designed to measure the performance of the large- and mid-cap segments of the Polish market. The S&P 500 Index returned 26.7% over this period. Indexes cannot be purchased directly by investors. S&P 500 Index is a market-capitalization-weighted index of the 500 largest domestic US stocks. Past performance does not guarantee future results.
4 Source: Bloomberg L.P., 3/31/24, as represented by the 10-year US Treasury rate.
5 Source: US Congressional Budget Office, 3/31/24. All data is estimated by the CBO and may not come to pass.
6 Source: “What is the relationship between Interest rates, growth, and Inflation,” Seeking Alpha, 5/4/2018.
7 Source: Bloomberg L.P., 3/31/24. Based on the returns of the sectors of the S&P 500 that are classified as being cyclical, such as financials, energy, materials, industrials, and consumer discretionary, as well as the return of the Russell 2000® Index and the Russell Midcap Index. The cyclical sectors of the S&P 500 Index returned 8.9% in the fourth quarter of 2023, while the Russell® 2000 Index and the Russell Midcap Index returned 14.0% and 12.8%, respectively. The Russell 2000 Index is comprised of the smallest 2000 companies in the Russell 3000 Index, which is an unmanaged index considered representative of the US stock market. The Russell Midcap Index measures the performance of the 800 smallest companies in the Russell 1000 Index, which is an unmanaged index considered representative of large-cap stocks. Indexes cannot be purchased directly by investors. All Russell indexes are a trademark/service mark of the Frank Russell Co. Past performance does not guarantee future results.
8 Source: Bloomberg L.P., Invesco, 12/31/23.
Copyright © Invesco