by Servo Wealth
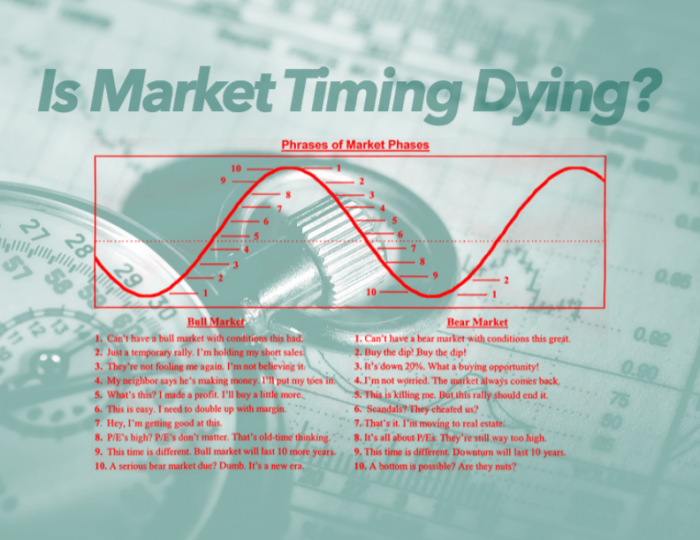
There is no siren song so seductive as one from an investment manager who promises the ability to adjust a portfolio proactively to sidestep bear markets while participating in bull markets, or to over/under weight asset classes profitably based on their relative valuation. We’ve covered this topic many times, but when new information presents itself, it is often worthwhile to report it.
It has now been almost five years since the Charles Schwab acquisition of Windward (now Windhaven) Investments—a highly-regarded ETF-based tactical investment manager (aka “market timer”) with an exemplarily mid-2000s track record. Windhaven experienced very minimal 2002 losses (the first year of their public track record) and lost far less than the overall market in 2008 while also capturing much of the upturn from 2003-2007. That’s technically three different “cycles” (a bear market, a bull market, and another bear market), which is usually long enough to convince most investors of the presence of skill instead of luck.
Or is it? The last five years offers the equivalent of “market-timer Kryptonite,” an out-of-sample period for which to test our hypothesis that Windhaven Investments is capable of tactically allocating across global stock/bond/alternative asset classes to produce superior risk-adjusted returns.
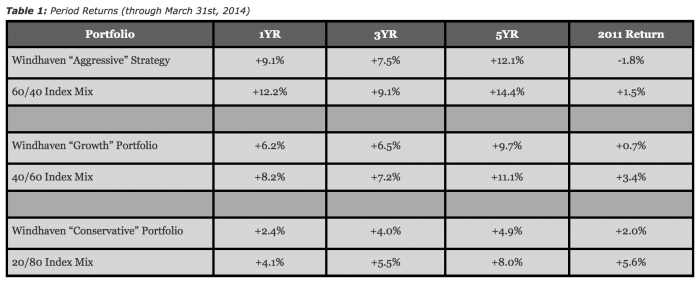
Table 1 shows that for every standardized period of a year or longer through Q1 2014 (the last period publicly reported by Windhaven), the Windhaven tactical portfolios have noticeably underperformed basic total stock/total bond index allocations. The differences are dramatic: the “Aggressive” Strategy underperformed by 2.3% per year, the “Growth” Strategy underperformed by 1.4% per year, and the “Conservative” Strategy trailed by 3.1% per year. The index mixes provided here aren’t exotic - they contain a basic US Total Stock, Total International Stock, and Total Bond split that can be purchased at any major discount brokerage firm using Vanguard or iShares ETFs, or the custodian’s own proprietary strategies (including the Schwab Family of Index funds).
While the last five years can rightly be categorized as a bull market, one that might not favor a market timer, it is also true that 2011 was no panacea. Global stocks fell over 20% in the summer and fall in response to the European Financial Crisis and the US debt downgrade. But even in 2011, no Windhaven portfolio was able to match the returns of the simple index allocations, either losing more or earning less in every case.
This poor showing by Windhaven might be understandable if the last few years had been one dominated by large cap, blue-chip global stocks (such as 1995-1999), given the significant emphasis placed on these companies by traditional stock index funds. But that does not appear to be the case. The 60/40 “Asset Class” Mix we used in this 2012 piece on Windhaven, which is more diversified across smaller and more value-oriented stocks, outperformed the 60/40 Index Mix by 1.5% per year over the last 5 years. The 40/60 version of the Asset Class Mix was +0.9% per year better than its Index counterpart. Only the 20/80 version of the Asset Class Mix trailed the associated Index Mix, and then only by 0.1% per year - a result due mostly to the higher returns from the riskier corporate bonds in the Index Portfolio.
Performance based on past results is a fickle proposition. If portfolio returns are the result of exposure to well-documented risk/return behaviors such as stocks over bonds, value over growth, and small over large, there is at least a reasonable chance based on logic and economic theory that they will persist. Market timing, on the other hand, no matter how sizzling the story or how intuitive the research, is more smoke and mirrors than financial science. Even in the case of Windhaven, who produced a track record over the better part of the mid-2000s that was the envy of the industry, outsized past performance was unlikely to persist. In the end, predictably, Windhaven turned out to be just another nail in the market-timing coffin.
_______________________________________
Source of data: DFA Returns 2.0; www.windhaveninvestments.com
60/40 Index Mix = 42% Russell 3000 Index, 18% MSCI All-Country World ex.US Index, 40% Barclays Aggregate Bond Index, rebalanced annually on Jan 1st.
40/60 Index Mix = 28% Russell 3000 Index, 12% MSCI All-Country World ex.US Index, 60% Barclays Aggregate Bond Index, rebalanced annually on Jan 1st.
20/80 Index Mix = 14% Russell 3000 Index, 6% MSCI All-Country World ex.US Index, 80% Barclays Aggregate Bond Index, rebalanced annually on Jan 1st.
-------------------
60/40 Asset Class Mix = 12% DFA US Large Company Fund, 12% DFA US Large Value Fund, 18% DFA US Small Value Fund, 6% DFA Int’l Value Fund, 6% DFA Int’l Small Value Fund, 6% DFA Emerging Markets Value Fund, 40% DFA Intermediate Government Fund. Rebalanced annually on Jan 1st.
40/60 Asset Class Mix = 8% DFA US Large Company Fund, 8% DFA US Large Value Fund, 12% DFA US Small Value Fund, 4% DFA Int’l Value Fund, 4% DFA Int’l Small Value Fund, 4% DFA Emerging Markets Value Fund, 60% DFA Intermediate Government Fund. Rebalanced annually on Jan 1st.
20/80 Asset Class Mix = 4% DFA US Large Company Fund, 4% DFA US Large Value Fund, 6% DFA US Small Value Fund, 2% DFA Int’l Value Fund, 2% DFA Int’l Small Value Fund, 2% DFA Emerging Markets Value Fund, 80% DFA Intermediate Government Fund. Rebalanced annually on Jan 1st.
Past performance is not a guarantee of future results. There are limitations inherent in model performance; it does not reflect trading in actual accounts and may not reflect the impact that economic and market factors may have had on an advisor’s decision-making if the advisor were managing actual client money. Model performance is hypothetical and is for illustrative purposes only. Model performance shown includes reinvestment of dividends and other earnings but does not reflect the deduction of investment advisory fees or other expenses except where noted. This content is provided for informational purposes and is not to be construed as an offer, solicitation, recommendation or endorsement of any particular security, products, or services.
Copyright © Servo Wealth