
by The Investment Team, Northern Trust
Views and projections as of April 16, 2024.
U.S. economic growth continues to surprise to the upside and the consensus expectation for full-year 2024 growth is now over 2%. During the March Federal Open Market Committee (FOMC), the Fed also raised its expectations for growth this year from 1.4% to 2.1%. Inflation has also been surprising to the upside. January, February and March inflation data was stronger than expected. Despite raising its year-end core inflation projection from 2.4% to 2.6%, the FOMC continued to project that its target policy rate will come down by 75 basis points by the end of 2024.
Our base case is that inflation will moderate by the end of this year, but near-term 3-month and 6-month momentum has been on an upward trend (see below chart). One source of concern is the stalling of the quits rate, which typically is a good indicator of wage inflation. A declining quits rate is associated with lower wage growth. Labor supply, via immigration, has had a positive effect on wage dynamics, but there is no clarity on whether this will persist after the U.S. Presidential Election. Meanwhile, goods prices are on an uptrend and housing-related inflation relief is yet to show up in the official statistics. This has led to some market uncertainty about the Fed’s willingness to ease monetary conditions. So far this year, this has manifested itself in rates and currency markets. Higher for longer has meant a backup in Treasury yields and a stronger dollar. But stocks have mostly shrugged off these interest rate dynamics. Equity markets have been following the improving growth trend.
Global economic developments have been positive on balance. The biggest improvement has been in the manufacturing segment, where Purchasing Managers’ Indexes (PMIs) have moved into expansionary territory (above 50) for several major economies. The global manufacturing PMI has now been in expansion for a full quarter. Aside from Japan, global central bankers are looking to cut rates later this year.
We made no changes to our asset allocation positions this month. Earnings should support global equities, but potentially higher bond yields could weigh on already high valuations, underpinning our neutral stance within a multi-asset portfolio. We are neutral across the regions within global equities. Spreads are tight for high yield bonds, but they should outperform investment grade (IG) bonds as we expect improving growth momentum to benefit riskier bonds, likely via reduced default risk. The higher yield on these bonds also provides some cushion against a backup in rates. We are underweight IG bonds, inflation-protected bonds and cash. We continue to maintain benchmark exposure to alternative assets such as natural resources, real estate and infrastructure given their role in the portfolio as diversifiers.
— Anwiti Bahuguna, Ph.D. – Chief Investment Officer, Global Asset Allocation
EXHIBIT 1: TOPPING EXPECTATIONS
U.S. economic growth continues to surprise to the upside, but so has inflation with momentum trending upwards.
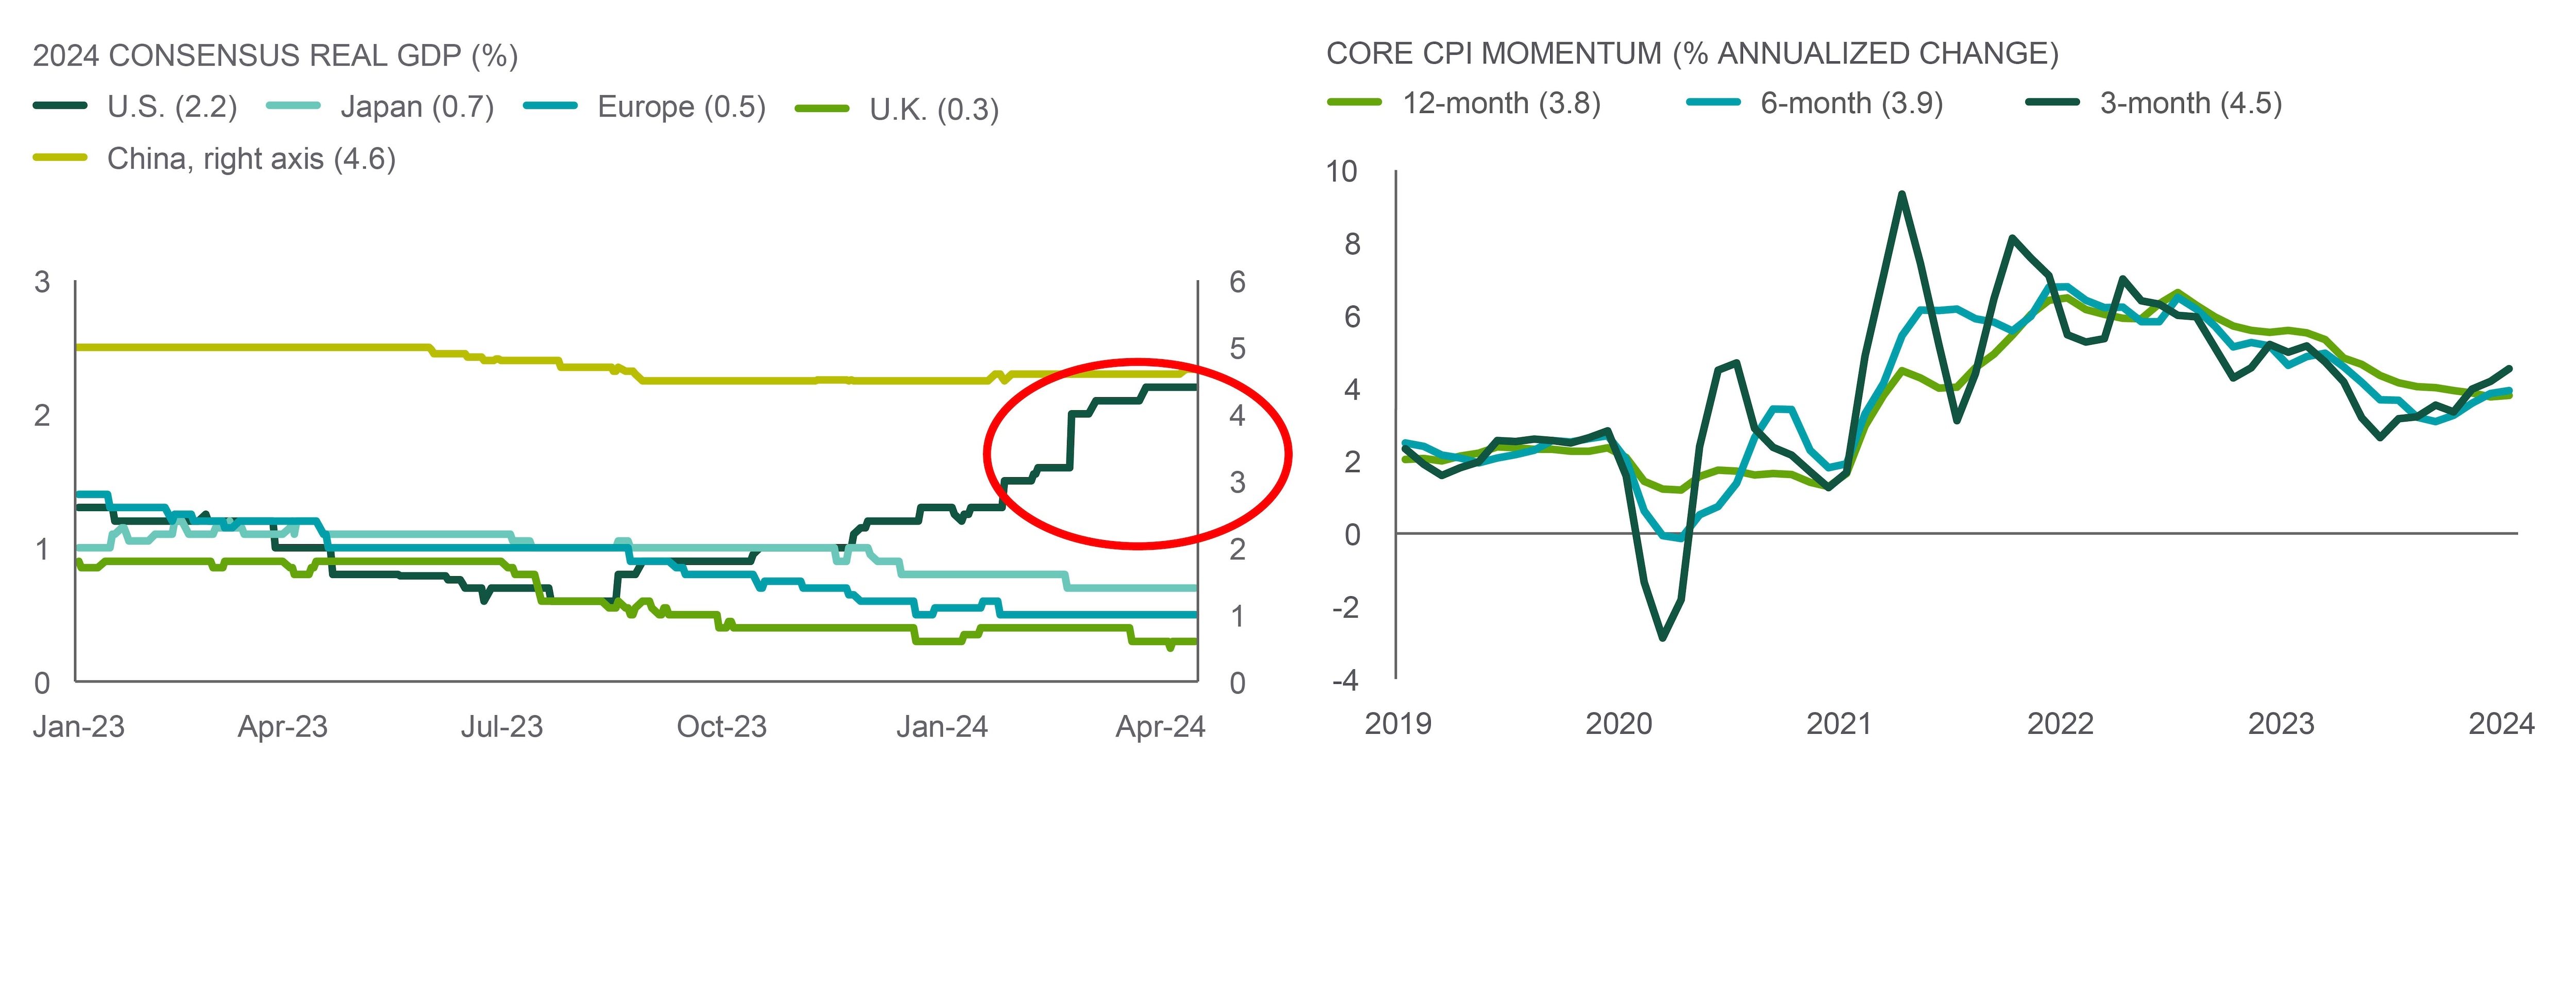
Source: Northern Trust Asset Management, Bloomberg. Left chart: Bloomberg consensus data. Consensus Gross Domestic Product (GDP) is the average level of the y/y change during the year (i.e., it uses 8 quarters of data). Data from 12/31/2022 through 4/15/2024. Core CPI data from 3/31/2019 through 3/31/2024.
Interest Rates
We previously flagged that we’re monitoring usage of the Fed’s Reverse Repo Facility (RRP) to watch for funding market disruptions that could have implications for the broader rates markets and the pace of quantitative tightening (QT). Thus far, some of the initial indicators of modest pressure around the turn of the year have dissipated, and the pace of decline in RRP usage has slowed. The FOMC discussed their plans for QT and the Fed’s balance sheet at the March FOMC meeting.
The March FOMC meeting minutes painted a picture of a Committee comfortable with reducing the pace of decline in the size of the balance sheet in half (from $60 to $30 billion of Treasuries per month). This was broadly in-line with market expectations, as was their preference to allow mortgage-backed securities to continue to roll off at the current pace. The minutes noted the Committee prefers to start tapering QT “sooner rather than later”. While the Committee hasn’t been in a hurry to make changes to QT this year, and money market conditions aren’t signaling an urgent need to shift balance sheet policy, we wouldn’t be surprised to see a reduction in QT announced at an upcoming FOMC meeting, perhaps as soon as May.
— Dan LaRocco, Head of U.S. Liquidity, Global Fixed Income
EXHIBIT 2: TAPER TIME?
The Fed indicated it could slow the pace of QT soon.
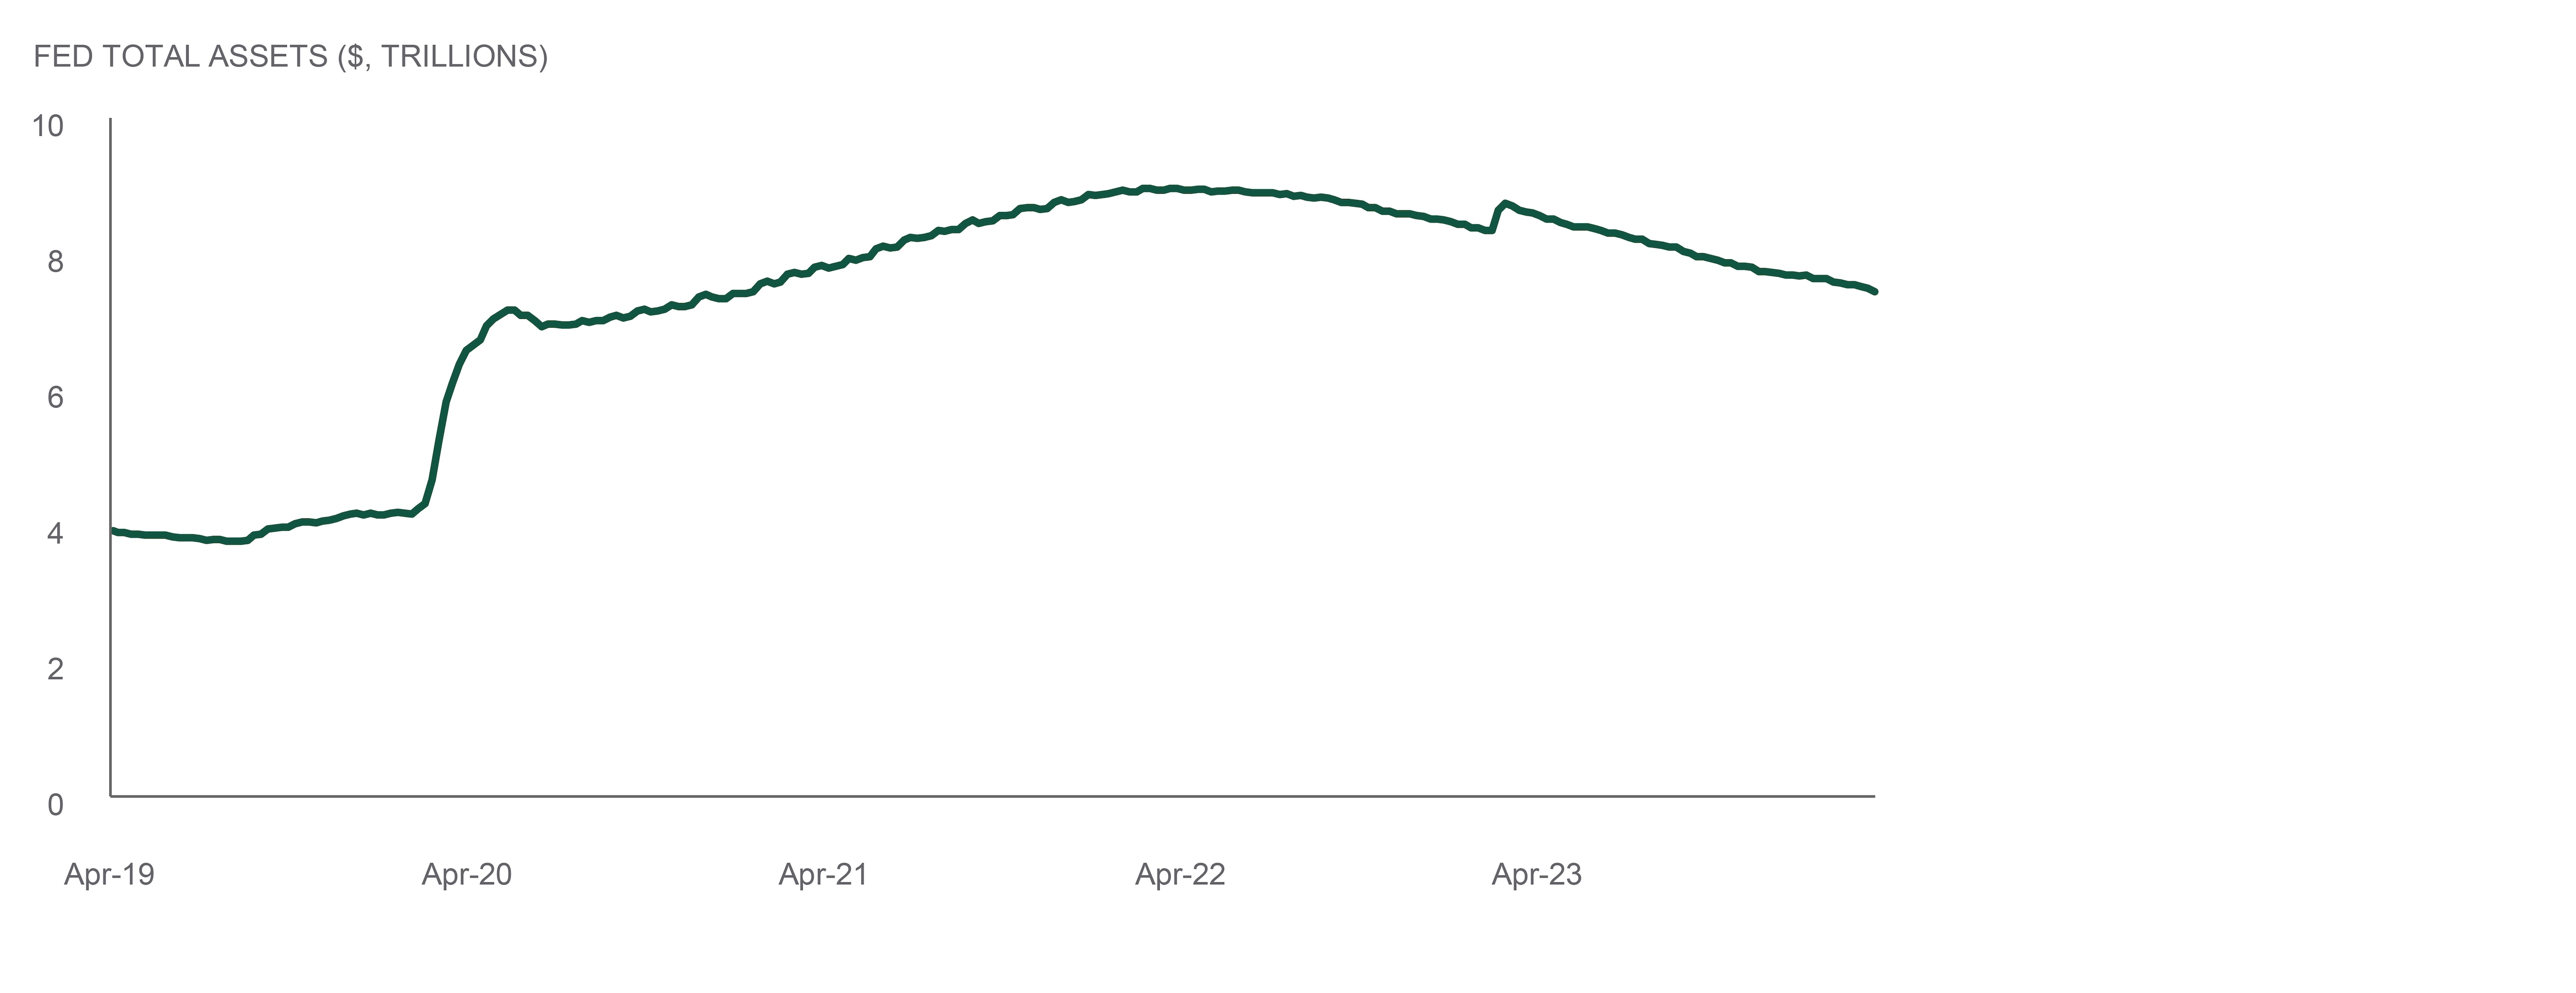
Source: Northern Trust Asset Management, Bloomberg. Data from 4/24/2019 through 4/3/2024. QT = quantitative tightening.
- The Fed indicated a potential reduction in the pace of quantitative tightening soon. The announcement was broadly in-line with market expectations.
- We wouldn’t be surprised if the Fed announces a reduction as soon as the May FOMC meeting.
- A proactive Fed should allow for a continuation of orderly conditions in the money markets.
Credit Markets
High yield saw solid performance in March as moderating supply and steady rates provided tailwinds. On the supply front, the first quarter was the busiest quarter in over two years. Some investors might expect more supply to be a headwind, however it is important to make a distinction between gross supply and net supply. A record ~83% of issuance year to date has been refinancing activity. Therefore, the amount of new debt coming to the market is sparse and easily absorbed. Not to mention, the high yield market has contracted for the past two consecutive years as well. Limited new net supply and the ability for companies to push out maturities are both constructive for the high yield market.
High yield corporate earnings and guidance have continued to be resilient in the face of higher rates. Almost 2x as many high yield companies have beaten EBITDA* expectations as have missed, and 19% of companies have warned that they are experiencing cost or labor inflationary pressures (down from 31% in 3Q23 and 33% in 2Q23). We believe technical and fundamentals trends in high yield continue to look favorable. It remains our largest tactical overweight in the Global Policy Model.
EXHIBIT 3: REFINANCING RECORD
A record proportion of issuance has been for refinancing.
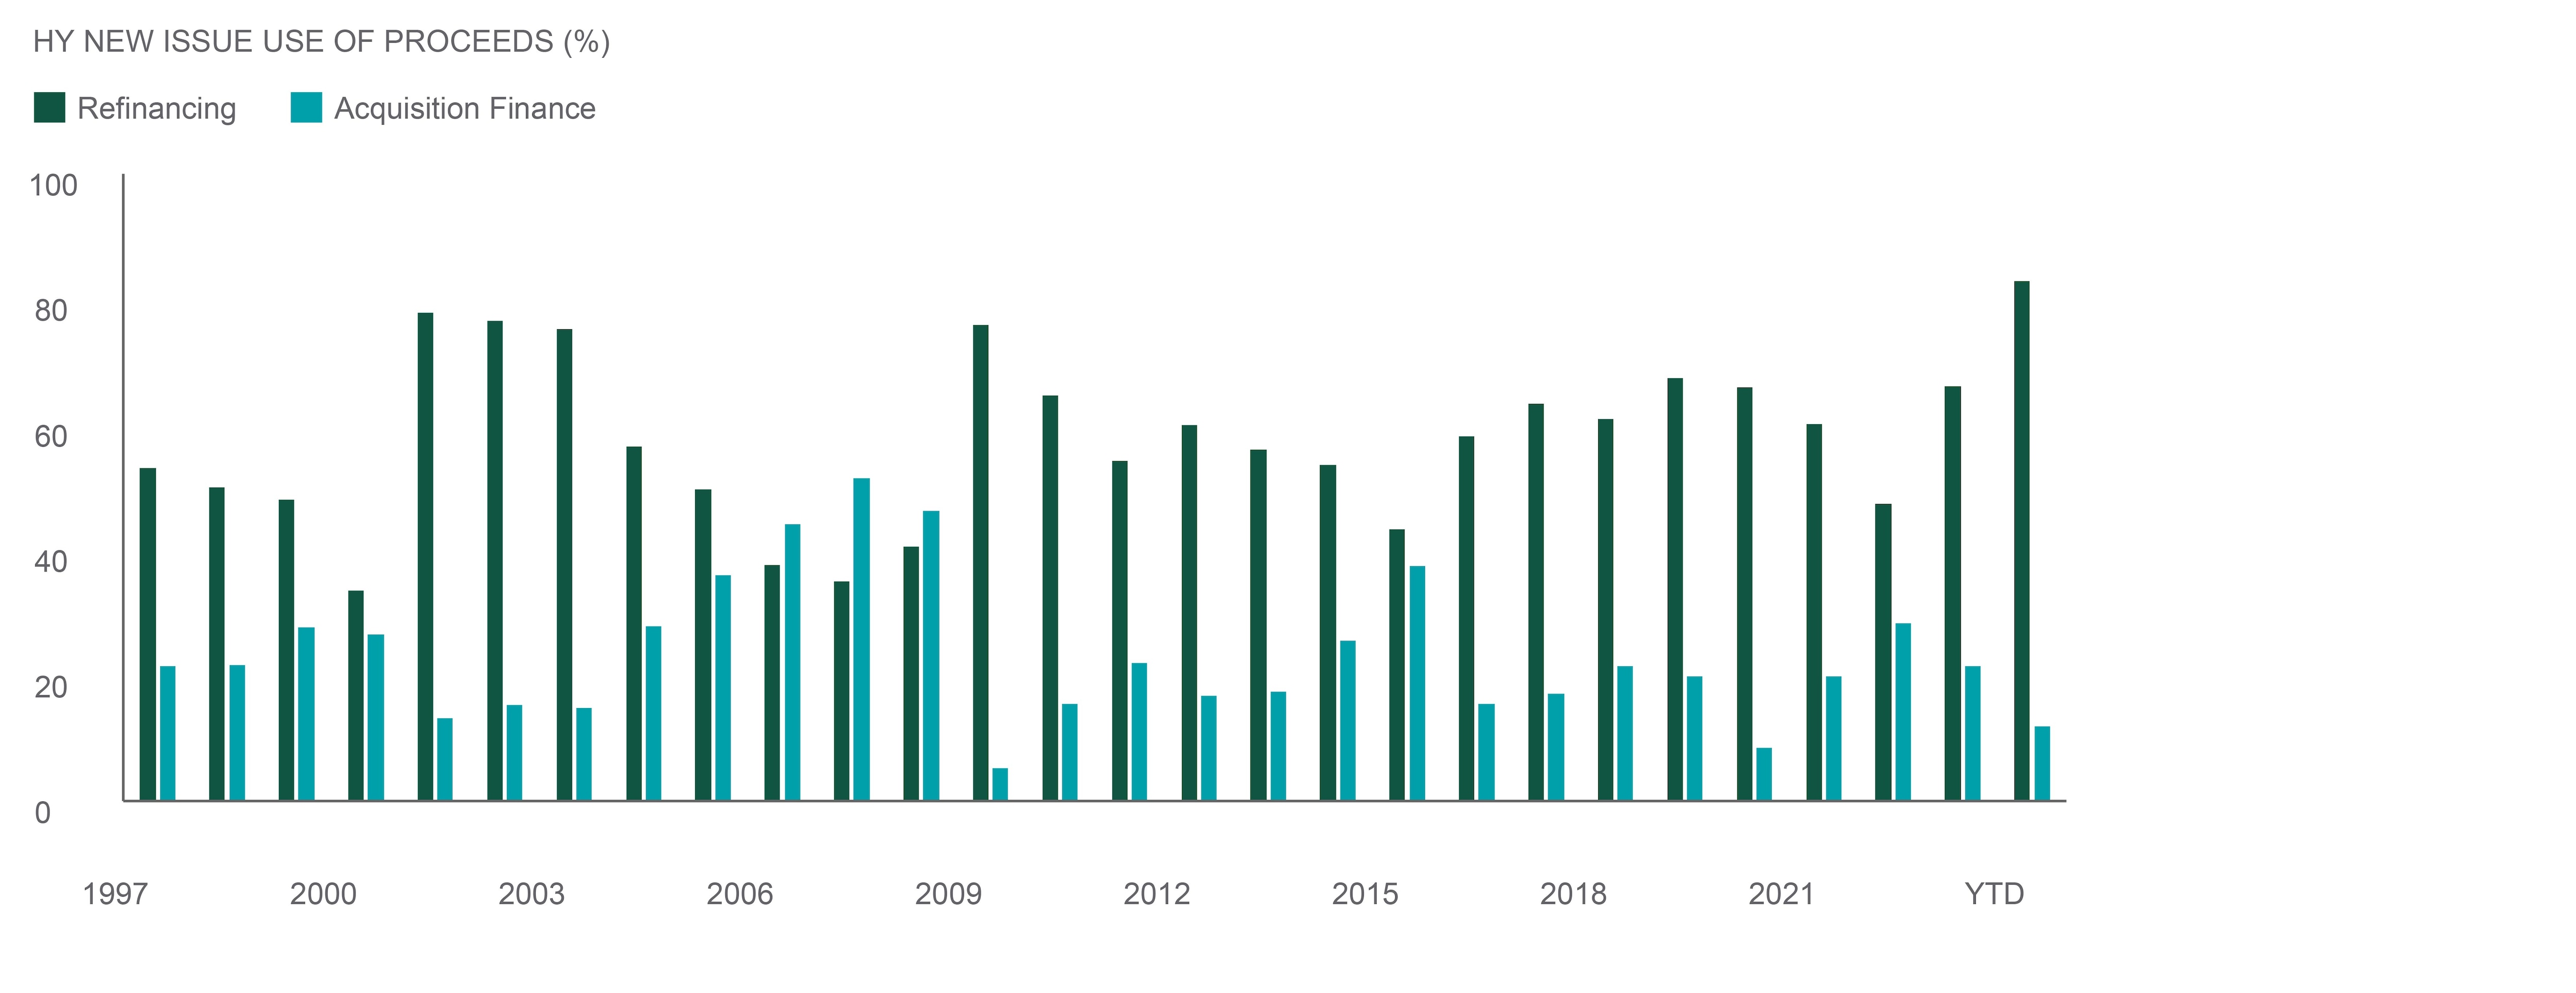
Source: Northern Trust Asset Management, JPMorgan. HY = High yield. Data as of 3/26/2024. *EBITDA = earnings before interest, taxes, depreciation, and amortization.
- The first quarter of this year was the busiest for high yield issuance in over two years.
- A record amount of issuance has been for refinancing, which has limited net new supply coming to market.
- We continue to see favorable technical and fundamental trends within high yield. We remain tactically overweight the asset class.
EQUITIES
As shown in the chart, cyclical stocks have outperformed defensives fairly consistently since the back half of January of this year. This period has coincided with persistent upside surprises to global economic growth led by the U.S. It has also overlapped with higher 2-year breakevens, suggesting greater concern on cyclical inflation. Equity markets have shaken off reflationary data, higher interest rates and reduced expectations for central bank rate cuts. As of April 10, global equities sat up about 7% on the year, tacking on about 40 basis points in the past month.
We made no changes to our tactical equity positions this month and we remain equal-weight all three of the major equity regions. We believe equity markets have already priced in a lot of the good economic news. Forward U.S. equity valuations sit above their 90th historical percentile and valuation expansion has continued to support returns. There is risk that higher bond yields and stubborn inflation could eventually weigh on valuations and sentiment. At the same time, we are hesitant to bet against further equity gains. The global earnings growth backdrop remains constructive, and our base case expectation for a soft landing would likely be broadly supportive for risk assets.
— Colin Cheesman, Investment Strategist, Asset Allocation
EXHIBIT 4: GROWTH IMPULSE
Positive growth surprises have helped cyclicals.
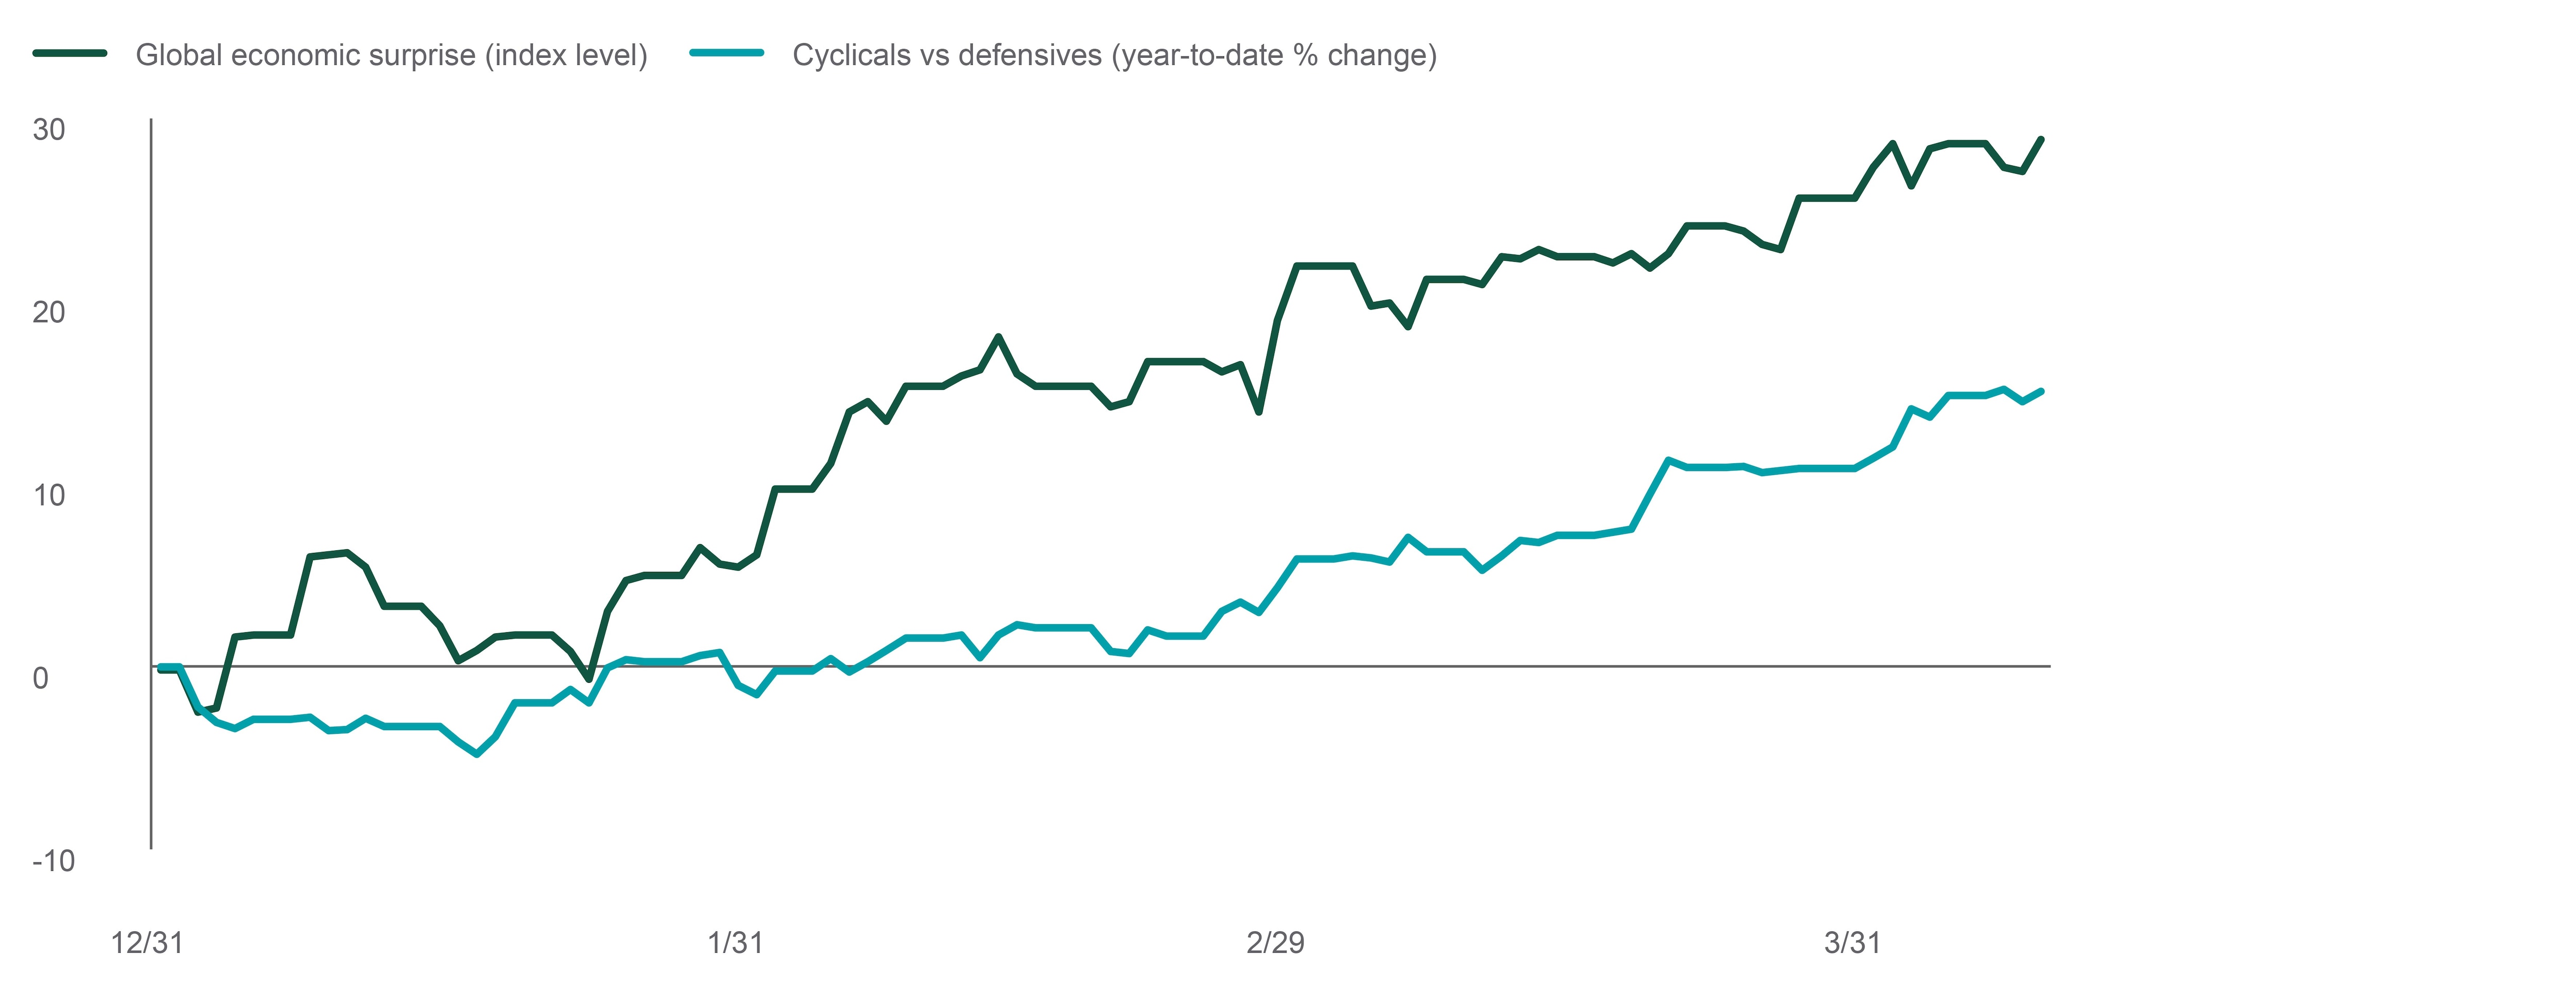
Source: Northern Trust Asset Management, Bloomberg, UBS, Citi. Year-to-date data as of 4/10/2024. Citi Global Economic Surprise Index (above 0 = positive surprise). Cyclicals versus defensives is the year-to-date change of the ratio of the UBS U.S. cyclicals versus defensives baskets. Past performance is not indicative or a guarantee of future results.
- Cyclical-oriented equities have done well alongside upside surprises to global economic growth.
- The strong growth data has coincided with firmer inflation. We expect both will ease before year-end.
- We think equity markets have priced in reasonable expectations. There is some risk of a pullback, but a constructive growth outlook keeps us neutral equities.
REAL ASSETS
All real assets sectors rose in March. Returns were strongest in Global Natural Resource Equities, which significantly outpaced the broader equity market. All subsectors within natural resources outperformed the broader market in a show of breadth. Metals and mining performance converged with oil and gas as investors saw value in two of the most cyclical real asset subsectors.
Energy performance seems to have been driven by a combination of lower cyclical risks amid resilient economic data, as well as global geopolitical concerns. Further, supply has come in with persistent softness in U.S. supply growth and Russia announcing production cuts. Several producers have pointed out that U.S. production has been weak year-to-date, citing extreme weather and constrained capacity. It appears this softness in U.S. supply is temporary but we again note that a productivity pickup in U.S. shale could provide a respite from higher oil prices.
We maintained our tactical neutral stance toward natural resources. Our strategic allocation should provide longer-term protection against unanticipated inflation and also act as a potential mitigant to geopolitical risk.
— Jim Hardman, Head of Real Assets, Multi-Manager Solutions
EXHIBIT 5: COMMODITY RESURGENCE
March brought a broad-based commodity rally.
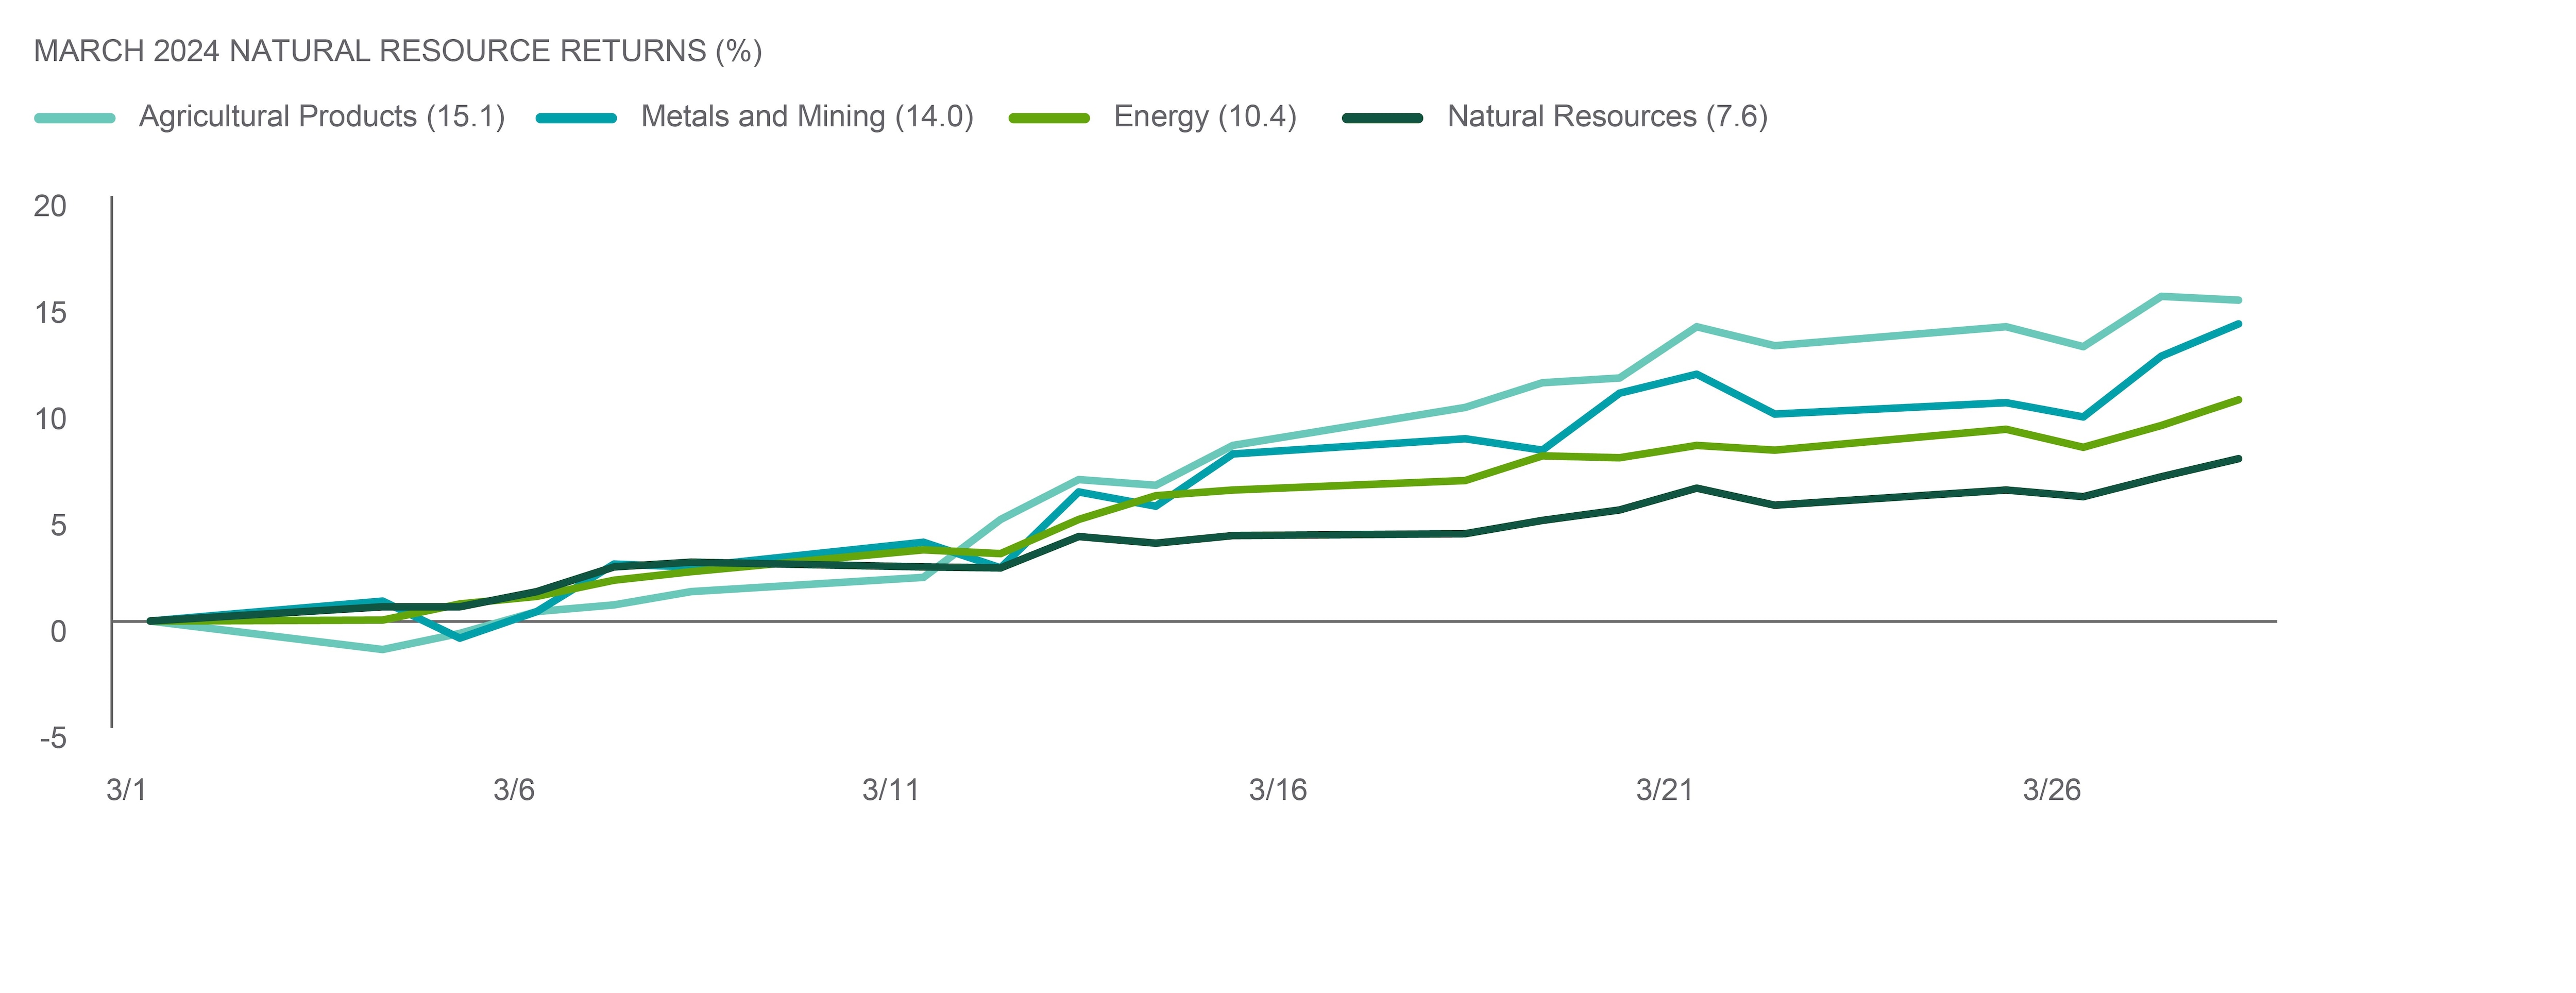
Source: Northern Trust Asset Management, Bloomberg. Data from 3/1/2024 through 3/28/2024. Past performance is not indicative or a guarantee of future results.
- Investors bid up natural resource equities in March, likely due to fading cyclical risks amid resilient economic data.
- Energy supply has undershot expectations this year. Markets are focused on the U.S. as the marginal producer.
- After a significant and broad run-up in energy-related natural resource equities, we continue to monitor geopolitical risks and energy market fundamentals. Tactically, we remain equal-weight natural resources.
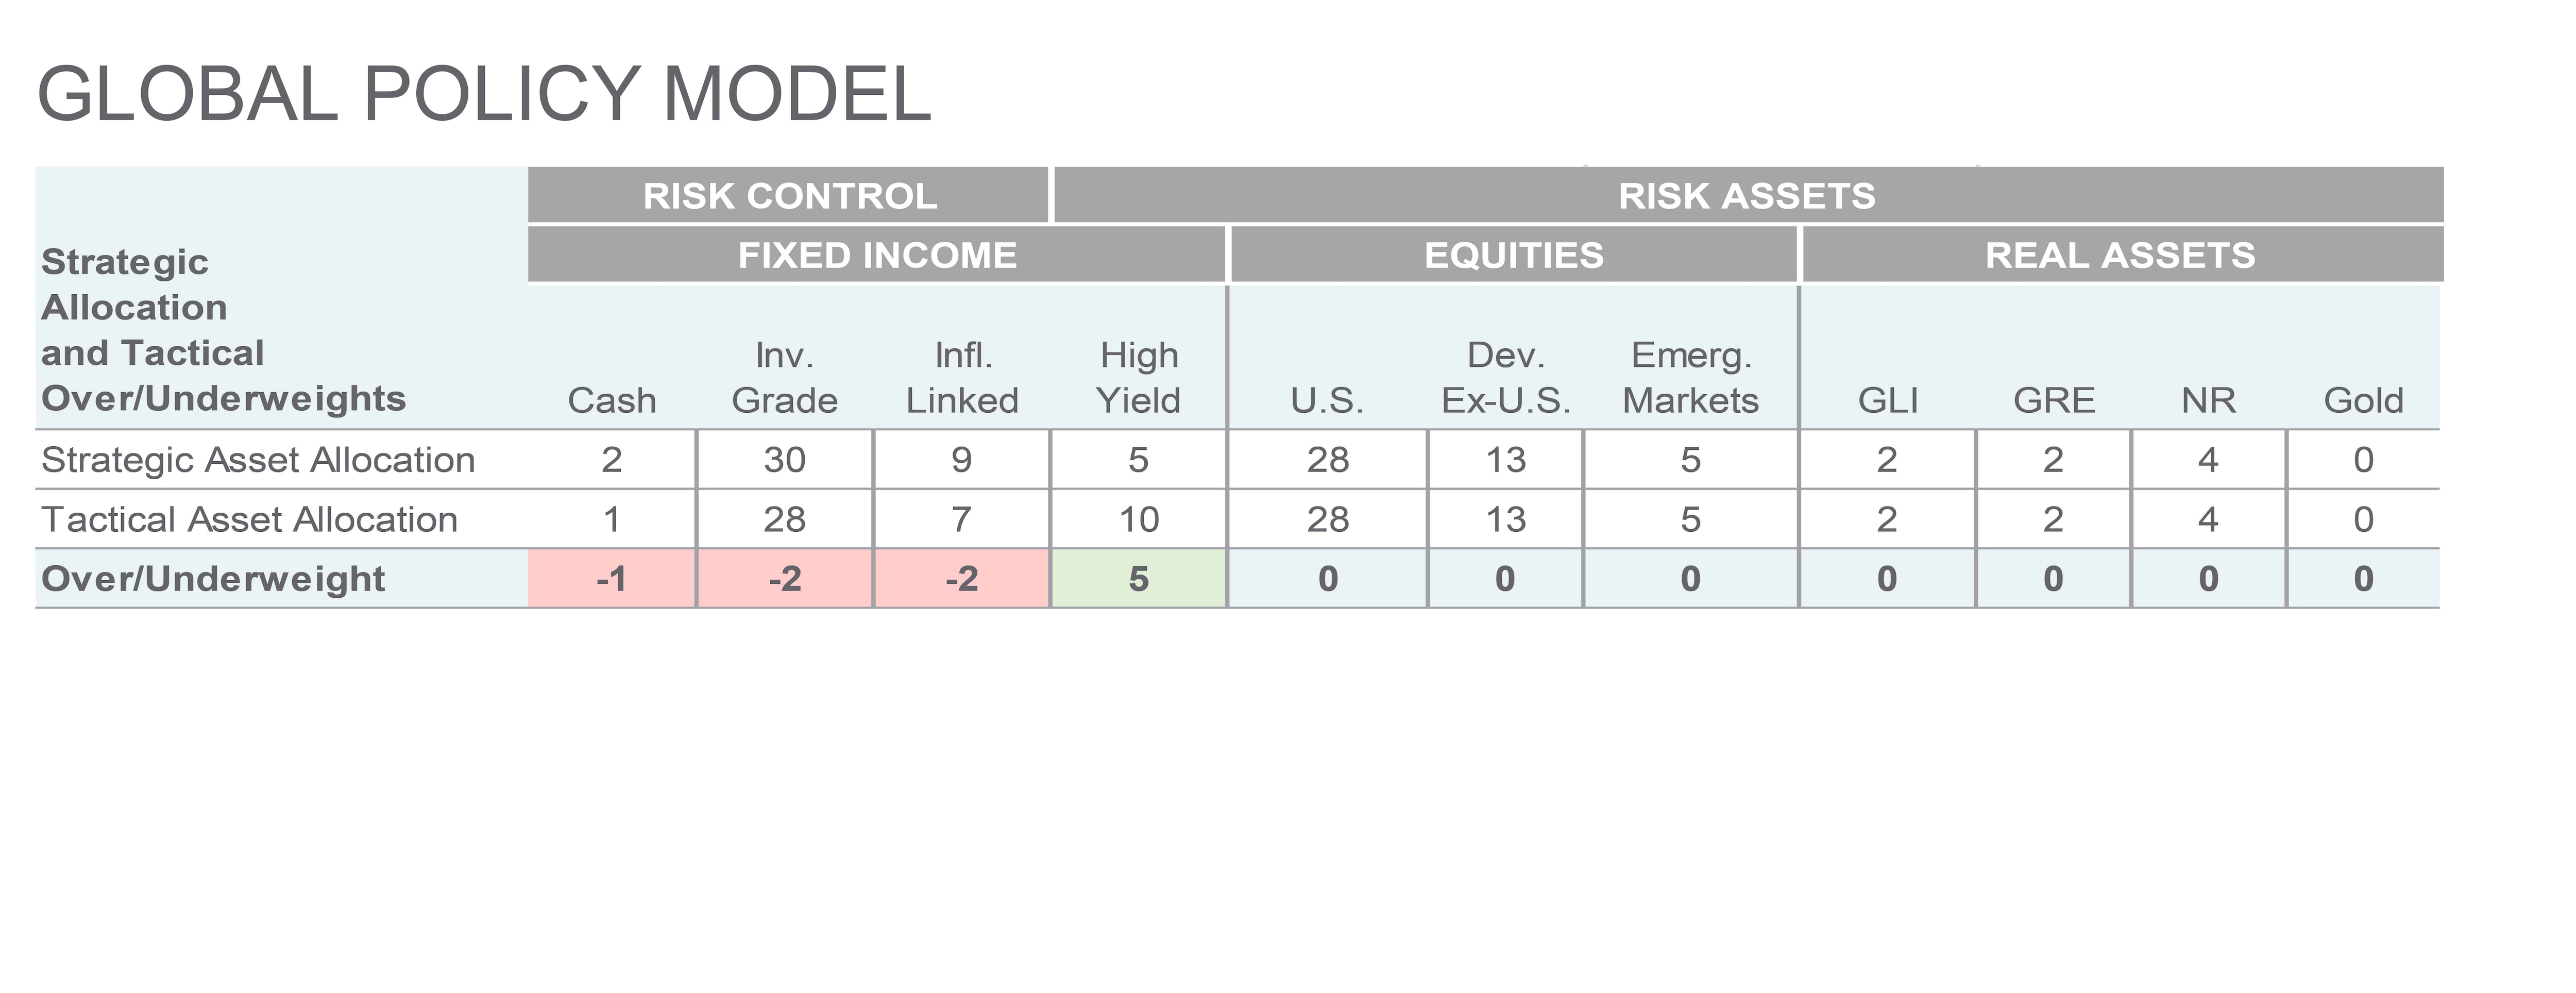
Source: Northern Trust Capital Market Assumptions Working Group, Investment Policy Committee. Strategic allocation is based on capital market return, risk and correlation assumptions developed annually; most recent model released 8/9/2023.The model cannot account for the impact that economic, market and other factors may have on the implementation and ongoing management of an actual investment strategy. Asset allocation does not guarantee a profit or protection against a loss in declining markets. GLI = Global Listed Infrastructure, GRE = Global Real Estate, NR = Natural Resources.
Copyright © Investment Team, Northern Trust