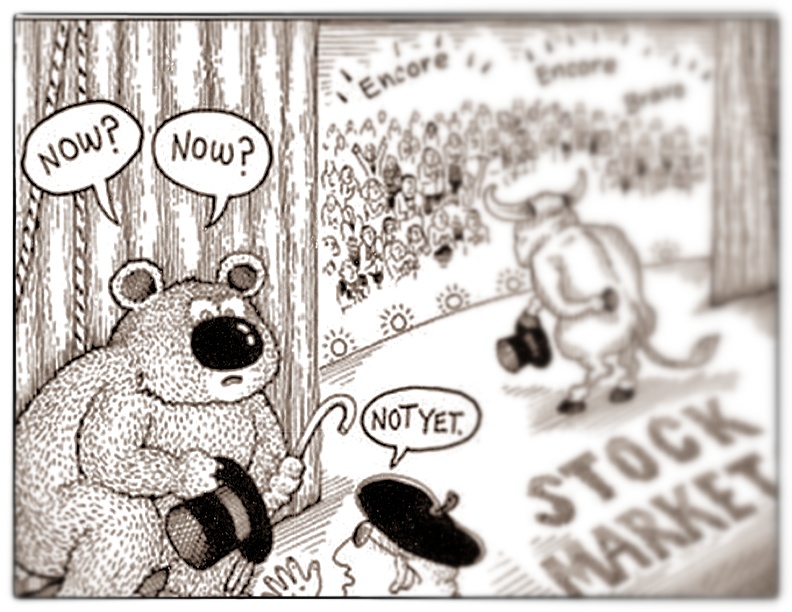
The Transition From a Risk Premium Reduction Market to a Growth Market
by Conor Sen
Matt Busigin (@mbusigin) and I were talking yesterday about price action YTD in markets, and about market cycles in general. He surmised that a market cycle has 4 basic components: recession (risk premiums increasing, drop in fixed investment, employment, and profits), recovery (risk premiums decreasing, normalization in sales, increase in profits), policy normalization (as spare capacity shrinks), and finally growth (expansion in fixed investment and employment, wage/inflation pressures, flattening/inversion of the yield curve).
Using this framework, the recession ended in March, 2009, and I’d argue that the recovery ended with the release of the April, 2013 jobs report early last May, as long bonds sold off and the yield curve steepened dramatically over the summer with the whisper of an impending taper from the Fed. The 2-year/10-year interest rate spread went from around 1.5% to 2.7% by the end of the year. That was the market pricing in an eventual policy normalization someday.

What we’ve seen so far in 2014 has been a flattening in the yield curve as the next step in the policy normalization phase occurs — the anticipation of rate hikes in the short-to-medium term. Since the end of the year the 10-year/5-year treasury spread has compressed by over 0.40%. Interestingly, the compression has occurred from yields on the long end falling — the 30-year treasury rate has fallen by over 0.45% YTD to its lowest level since June, while the 5-year rate remains near recent highs.

In terms of economic activity, we’ve seen signs over the past 2-3 months that the growth cycle may be closer than the market appreciates. Loan growth has picked up notably since February:

Additionally, hourly wage growth clearly bottomed in October, 2012, and while weather has distorted the past few months of jobs reports, it appears that hourly wage growth may be accelerating. I expect hourly wage growth for production and nonsupervisory employees to approach 3% or more by the end of the year.

The only thing that’s going to stop this economic cycle from being the longest in history will be a Fed resolved to stick to a 2% inflation target. As I’ve said over and over, fixed residential and non-residential investment, now 5+ years after the end of the recession, remains near levels that would be considered a bad recession. Resources that might normally have gone back into the fixed investment sector have been redeployed elsewhere, so that when robust demand returns we’ll need price signals to incentivize resources back into the fixed investment sector. All signs point to inflation meaningfully higher than the Fed’s 2% target later this decade. Getting nonresidential + residential fixed investment as a % of GDP back to 18%, robust but not crazy overheated, at the growth pace we saw in the 1990’s and from 2003-2006, would take an additional 4.5 years. If we overshot to 19%+ that’d be another 2 years. And then perhaps another year or so to go from peak fixed investment to recession. In other words, it’s not unreasonable at all to think that the next recession resulting from over-investment wouldn’t begin until the year 2020 or 2021.

So what to make of the churn in equities in the first part of this year? Markets and the economy can get disconnected from each other. Equities had gone up nearly in a straight line since the fall of 2011 into the beginning of 2014. Hedge funds and momentum players in particular had made a killing on growth stocks. A correction was long overdue. Perhaps it didn’t make sense, for instance, for Workday to trade at 20x CY 2015 revenues.
Additionally, and this happened in early 2000, after a strong year for equities investors were going to get hit with a big capital gains tax bill due in April. A busy IPO calendar also demanded liquidity from the same hyper-active investors who booked 2013 gains in growth stocks. Liquidity demands for both taxes and new IPO’s combined with hedge funds and momentum investors going from buyers and sellers resulted in a mess. If 2000 and 2005 are any guide, the worst of it should be over.
We’re in the heart of earnings season and so far, we’re seeing full year guidance hold up better than it typically does. The Goldman Sachs strategy team, one of the best out there, continues to stick to an EPS estimate for the S&P 500 this year of $116. At current prices, that makes stocks valued at about the same level they were in 1995 or 2005, hardly bubbly years or near the end of bull cycles. In addition the Baa yield in the 4.8%’s is roughly 150bps lower than it was in 2005 and 250bps lower than it was in 1995, making equities significantly more attractive than corporate bonds.
Yes, profit margins appear perhaps unsustainably high, but with equities much more attractive than corporate bonds and the employment/fixed investment/household leverage cycle arguably just beginning after 6 years of retrenchment, there’s no reason to believe this equity bull market will end for at least a couple more years, and arguably much longer.
Copyright © Conor Sen


