The Steepening Effect
by Alfred Lee, CFA, CMT, DMS, Vice President, BMO ETFs
Portfolio Manager & Investment Strategist
BMO Asset Management Inc.
alfred.lee{at}bmo.com
In this report, we highlight our strategic and tactical portfolio positioning strategies for the second quarter using various BMO Exchange Traded Funds. Our key strategy changes are outlined throughout the report and in our quarterly outlook on page six.
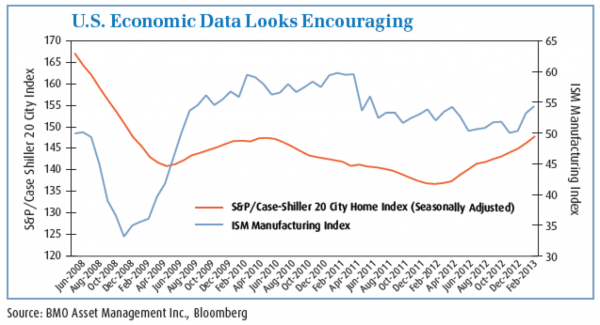
• The predominant theme over the last quarter has been encouraging signs of a U.S. economic recovery. The U.S. Purchasing Managers Index (PMI)1 currently sits at 54.6, well above the critical 50 which indicates expansion. The bottom in U.S. housing looks to be behind us, with the S&P Case-Shiller 20-City Home Price (Seasonally Adjusted) Index2 rising over the last 11 months consecutively. Mortgage delinquencies have also abated with mortgage delinquencies as a percentage of total loans (seasonally adjusted) at 7.09%, below its March 2010 high of 10.06% and more importantly, trending lower.
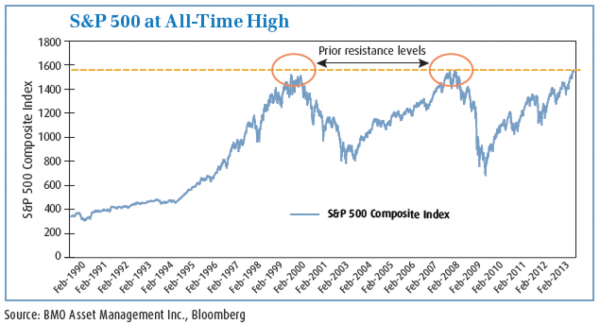
• U.S. Equity markets, where we have recommended an overweight for the last two and half years, have rallied to all-time highs. This rally has placed significant upward pressure on the long-end of the yield curve (both U.S. and Canada), leading to further re-allocation from bonds into equities. Keep in mind these levels in both the Dow Jones Industrial Average (Dow) and the S&P 500 Composite Index (S&P 500) are where two cyclical equity rallies have failed in the past (both the “dot com-rally” in 2002 and the “pre-Lehman”3 rally in 2008). The next twelve months will be critical and should this resistance point be breached (see chart below), this could potentially set the stage for the next secular bull-market.
• Cyprus has become the new headline risk. The solvency of a number of Cypriot banks have become a concern as a number of these institutions made bad investments in Greece. The current proposal of applying a levy to depositors to raise cash is leading to a loss of confidence in its banks. It is important that policy makers resolve the issue in a manner that does not cause investors to lose confidence in the Eurozone.
• European bond yields have notably risen for some sovereigns over the quarter, but borrowing rates for most countries in the European Union (EU) remain subdued overall. Economic data suggests economies in Europe are still contracting, even Germany’s PMI is now back below 50. Should the European Central Bank (ECB) continue to be successful in suppressing risk in the region, European equities could provide the most upside opportunity for investors with a higher risk tolerance. Of course, this is also where the greatest probability of a tail-risk event3 could occur. As a result, we have avoided recommending exposure to Europe, instead focusing on the U.S. and defensive related themes in Canada.
• Most political events that have occurred in the last several years have been met with an eleventh hour reprieve. The recent U.S. sequester, where U.S.$85 billion in budget cuts will take effect over the next ten months, was thought to be a potential major stumbling block. The equity market shrugged off the announcement a month ago, but as mentioned in our last report, our short-term concern over this event is a repricing of risk. The rally in the last several months has led many investors to throw caution to the wind, leaving their positions in equities exposed to the first unforeseen headline risk. Over the short term, given equity markets around the world are significantly overbought, a correction would, however, likely be exaggerated, with equities being especially vulnerable.
Things to Keep an Eye on...
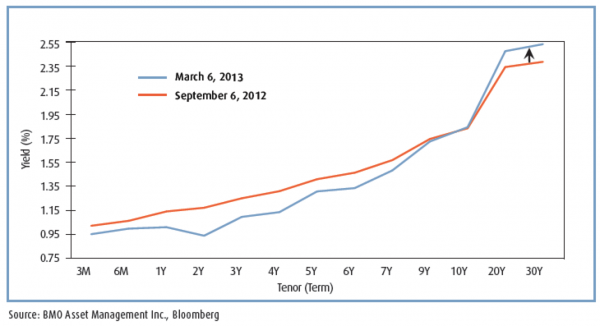
The yield curves (in the U.S. and Canada) have steepened considerably over the last six months. Should this continue, upward pressure on the long-end of the curve will force investors out of interest rate sensitive areas, particularly government issued bonds. This would lead to a major asset allocation shift to equities, placing more upward pressure on the longer dated yields and potentially setting the stage for a new secular bull market in equities. An ongoing steepening of the yield curve would lead to a further “melt-up” in equities.
Recommendation: Over the last six months, we have slowly shifted out of rate sensitive areas in our strategy portfolio. We have decreased our exposure to federal bonds, preferring corporate exposure, anticipating an improving economy as a positive for credit spreads. Additionally, we are increasing our exposure to rate reset preferred shares which are less sensitive to rising interest rates than their straight perpetual counterparts.
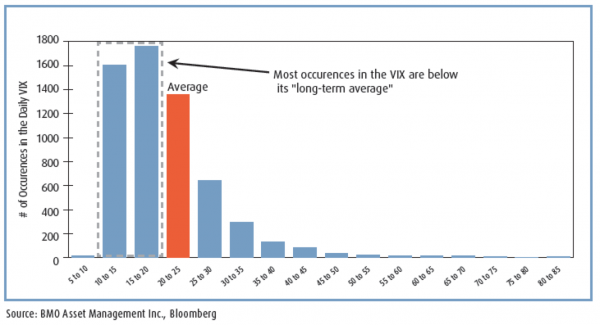
Much has been said about equity market volatility remaining below its long-term average. Implied volatility indices from all over the world, including the VIX, VXD, VIXC and VSTOXX4, are well below 20, roughly their long-term averages. What should be noted, however, is that equity market volatility exhibits a right skew, where the median is lower than its mean. Extreme occurrences do happen on the right side of the distribution, meaning portfolios should have defensive characteristic to protect against sudden increases in equity market volatility.
Recommendation: We have been reluctant to move away from our defensive core despite the rally in risk assets over the last six months. Our strategy has been to focus on riskadjusted returns, while providing better downside protection than a traditional 60/40 (equity/bond) portfolio. Holdings such as our BMO Low Volatility Canadian ETF (ZLB) remain key positions within our strategy.
For a very long time, the U.S. dollar was negatively correlated to risk assets. When equities appreciated, the U.S. dollar tended to depreciate and vice versa. However, since the new year, the U.S. dollar has gained alongside the rally in U.S. equities, likely due to the lack of stability in other major currencies. The Japanese yen, for example, has plummeted 7.2% since the new year and the rally in the Euro seems to have run its course as it has declined 2.8% over the same period (both currencies measured against the USD).
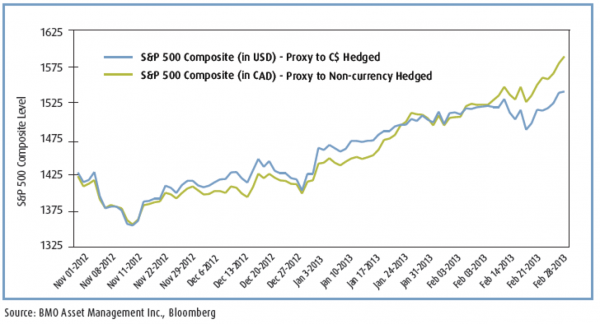
Recommendation: Last quarter, we recommended investors switch from currency hedged S&P 500 exposure to non-currency hedged S&P 500 exposure, as we believed its negative correlation would provide a partial hedge against falling risk assets. Although this negative correlation hasn’t held in the last several months, the decision to unhedge USD/CAD exposure has attributed to positive returns to the strategy. Since January 1, 2013, the 12.9% return of S&P 500 in CAD has exceeded the 10.7% return of the S&P 500 in USD. We continue to recommend holding S&P 500 exposure without a currency hedge.
Changes to the Portfolio Strategy:
Asset Allocation:
• The recent equity rally has led to a steepening of the yield curve. The 30-year Government of Canada yield has risen 18.2bps over the last six months. Last quarter we increased the cyclicality in the equity portion of our strategy. This quarter we are increasing our equity exposure slightly despite the near-term risk. From an asset class perspective, bonds tend to outperform during deflation and commodities during times of inflation. The current environment, with neither signs of deflation nor inflation, from our perspective, is a “sweet spot” for equities. Though we believe the low interest rate environment will remain over the next two years, ongoing evidence of an economic recovery will likely lead rates to rise steadily, especially on the long-end. With that backdrop, our strategy is an income-oriented core, integrated with key cyclical themes and areas that are less sensitive to interest rates. Fixed Income:
• Emerging market bonds have experienced a sizable rally over the last five years. Price gains have led yields to drop as a result. We remain constructive in this area, however, we believe other areas in fixed income offer better volatility adjusted yields. Since we view asset and sector selection from a portfolio construction standpoint, our increase in equity beta should be offset accordingly by a decrease in fixed income beta. We are thus eliminating our position in the BMO Emerging Market Bonds Hedged to CAD Index ETF (ZEF).
• Since we initiated our Portfolio Strategy Report, we have gradually increased our exposure to mid-term Canadian corporate bonds. As a steepening in the yield curve indirectly implies an improving economy, we continue to favour credit related assets such as corporate bonds over interest rate related areas such as government bonds. The BMO Mid-Corporate Bond Index ETF (ZCM) still remains an integral part of our strategy, however, we are reducing our exposure by 2.0% due to the overconcentration of financials and energy in mid-term corporate bonds.
• Where the mid-term Canadian corporate bond market is somewhat concentrated, the U.S. investment grade corporate bond market is much more diversified. Moreover, U.S. corporations are larger than their Canadian counterparts, potentially providing more stability and exposure to debt issued by world renowned companies. We are initiating a 7.0% position in the BMO U.S. Mid-Term I.G. Corporate Bond Index ETF (ZIG), which holds bonds issued by companies such as Coca Cola Inc., Microsoft Corp. and General Electric Co. Similar to our U.S. equity exposure, we are choosing to leave our U.S. currency exposure unhedged. Equities:
• The dividend yield of both the S&P 500 and the S&P/TSX Composite Index (S&P/TSX) continues to be higher than the 10-year yields of the bonds issued by their respective federal governments. With the aging demographics in these developed nations, dividend oriented equities will continue to be a large focus of our equity strategy. With gold and base metals facing headwinds, our strategy will continue to focus on areas of the Canadian market that are less volatile (less exposed to commodities) and more exposed to the broad U.S. market. This quarter we are increasing our exposure to our BMO Low Volatility Canadian Equity ETF (ZLB) by 2.5%.
• Encouraging signs of an economic recovery in North America should be favourable for industrial related stocks. Many of these companies involved in areas like machinery, transport and aerospace are critical to the functionality of the economy. Furthermore, the industrial sector has tended to perform well during this stage of past economic cycles and is suitable for sector rotation strategies. We are thus initiating a 3.0% position in the BMO Equal Weight Industrial Index ETF (ZIN). Alternatives/Hybrids:
• U.S. high yield bonds have been one of the key themes in our portfolio strategy over the last several years. Strong balance sheets and low default rates have made this area attractive to yield-oriented investors. Credit spreads between non-investment grade debt and U.S treasuries have narrowed to multi-year lows, which will likely limit upside. The recent equity rally may also potentially lead investors to allocate away from U.S. high yield bonds to stocks, given the equity-like characteristics of U.S. high yield bonds. We currently favour U.S. high yield bonds over emerging market debt as we prefer corporates to sovereigns, especially with an improving business environment in North America keeping default rates relatively low. However, we are reducing our exposure to U.S. high yield debt by 2.0%.
• Gold prices continue to face significant headwinds both from a macroeconomic and technical perspective. Economic data shows evidence of an U.S. economic recovery and improving conditions in China. Liquidity and default concerns in Europe have also been reduced, leading to less demand for precious metals as a hedge against macro-risk. Money velocity still remains low, which prevents inflation. Lastly, a rallying U.S. dollar has been a headwind for gold, recently leading it to experience a technical breakdown which in itself could result in further selling pressure. Last quarter we reduced our exposure to precious metals by 2.0%, and now we are eliminating our remaining 5.0% position in the BMO Precious Metal Commodity Index ETF (ZCP).
• Last quarter we initiated a 5.0% position in the BMO S&P/TSX Laddered Preferred Share Index ETF (ZPR). Our rationale for preferred share exposure was its low correlation to traditional assets such as bonds and equities. As indicators suggest interest rates have bottomed, we favour rate reset over perpetual preferred shares. For a better description of the different types of preferred shares, please see our Understanding Preferred Shares whitepaper found on the BMO ETFs website. This quarter we are increasing our exposure to ZPR by 2.0%.
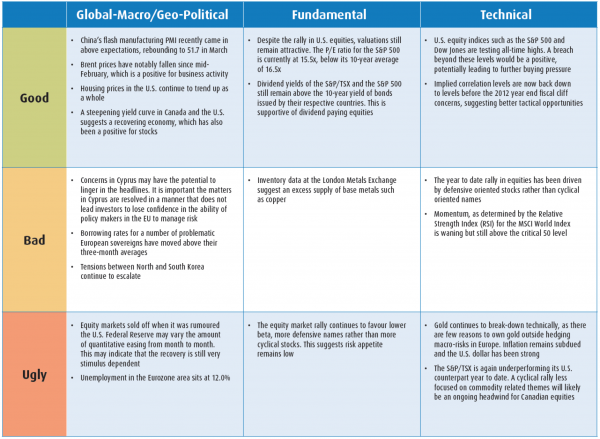
The Good, the Bad, and the Ugly
Conclusion: The continuation of the equity rally will be largely determined by the shift in the yield curve and the ability of policy makers in the European Union to manage the headline risk of Cyprus. An enduring rally over the next quarter would cause the yield curve to further steepen. This would lead more investors to shift from long duration bond exposure, to shorter term credit and equity exposure. This rotation out of bonds is the cause of the equity “melt-up” over the last three quarters. Our strategy continues to focus on defensive and/or dividend paying equities, while overweighting credit in the fixed income space. In addition, areas such as preferred shares and U.S. high yield bonds are used as portfolio diversifiers.
Footnotes
1 Purchasing Managers’ Index (PMI) is an economic indicator on the financial activity reflecting purchasing managers’ acquisition of goods and services. Data is for the PMI are compiled by monthly surveys polling businesses that represent the make up of the respective sector. The surveys cover private sector companies, but not the public sector. A number above 50 indicates economic expansion, whereas a number below 50 suggests economic contraction.
2 S&P Case-Shiller 20 City Home Price (Seasonally Adjusted) Index: A composite index of the home prices for 20 major metropolitan areas in the U.S. This version is removes the seasonal component of the index.
3 “Pre-Lehman”: Refers to the period prior to the collapse of investment bank Lehman Brothers Holding Inc.
4 “VIX”, “VXD”, “VIXC” and “VSTOXX”: Are measures of the market’s expectations of 30-day volatility, annualized. It is constructed using the implied volatility measures based off of varying constituent options of their respective underlying market indices. These measures are meant to be forward looking and are calculated using both call and put options. Higher readings of each of the implied volatility indices indicate a greater level of unease with investors. These implied volatility measures are calculated based off of option contracts for their respective underlying indices. VIX is based off the S&P 500 Composite, VXD is based off the Dow Jones Industrial Average, VIXC is based off the S&P/TSX 60 Index and the VSTOXX is based off of the Euro STOXX50 Index.
Disclaimer
The Dow Jones Industrial AverageSM is a product of Dow Jones Opco, LLC, (“Dow Jones Opco”), a subsidiary of S&P Dow Jones Indices LLC and has been licensed for use. Dow Jones® and Dow Jones Industrial AverageSM are service marks of Dow Jones Trademark Holdings, LLC (“Dow Jones”) and have been licensed for use for certain purposes by BMO Asset Management Inc. BMO ETFs based on Dow Jones indexes are not sponsored, endorsed, sold or promoted by Dow Jones Opco, Dow Jones or their respective affiliates, and Dow Jones Opco, Dow Jones and their respective affiliates make no representation regarding the advisability of investing in such product(s).
”S&P®” and “S&P 500®” are trade-marks of S&P Opco, LLC and “TSX” is a trade-mark of TSX Inc. These and other associated trade-marks and/or service marks have been licensed for use by BMO Asset Management Inc. None of the BMO ETFs are sponsored, endorsed, sold or promoted by any of its aforementioned trade-mark owners and the related index providers or their respective affiliates or their third party licensors and these entities make no representation, warranty or condition regarding the advisability of buying, selling or holding units in the BMO ETFs. Nasdaq®, OMX®, NASDAQ OMX®, Nasdaq-100®, and Nasdaq-100 Index®, are registered trademarks of The NASDAQ OMX Group, Inc. (which with
its affiliates is referred to as the “Corporations”) and are licensed for use by BMO Asset Management Inc. The BMO Nasdaq 100 Equity Hedged to CAD Index ETF has not been passed on by the Corporations as to its legality or suitability and is not issued, endorsed, sold, or promoted by the Corporations. THE CORPORATIONS MAKE NO WARRANTIES AND BEAR NO LIABILITY WITH RESPECT TO The BMO Nasdaq 100 Equity Hedged to CAD Index ETF.
This communication is intended for informational purposes only and is not, and should not be construed as, investment and/or tax advice to any individual. Particular investments and/or trading strategies should be evaluated relative to each individual’s circumstances. Individuals should seek the advice of professionals, as appropriate, regarding any particular investment.
BMO ETFs are managed and administered by BMO Asset Management Inc., an investment fund manager and portfolio manager, and separate legal entity from Bank of Montreal.
Commissions, management fees and expenses all may be associated with investments in exchange traded funds. The indicated rates of return are the historical annual compound total returns including changes in prices and reinvestment of all distributions and do not take into account commission charges or income taxes payable by any unitholder that would have reduced returns. Please read the prospectus before investing. Exchange traded funds are not guaranteed, their value change frequently and past performance may not be repeated. ® BMO (M-bar roundel symbol) is registered trade-mark of Bank of Montreal, used under licence.


