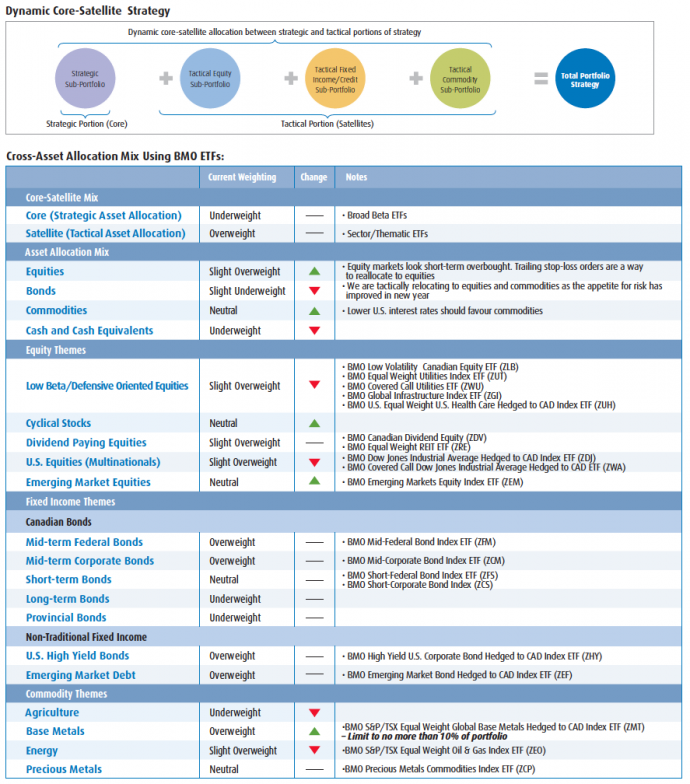
Recommendation: Investors looking for exposure in emerging market equities may want to consider a broader exposure than the BRIC nations. The BMO Emerging Markets Equity Index ETF (ZEM) is an efficient way for investors to access broad exposure to emerging market equities at a low cost. As emerging market equities tend to decline more than U.S. equities during sell-offs, again a trailing stop-loss order is an efficient way for investors to build exposure to emerging market equities.
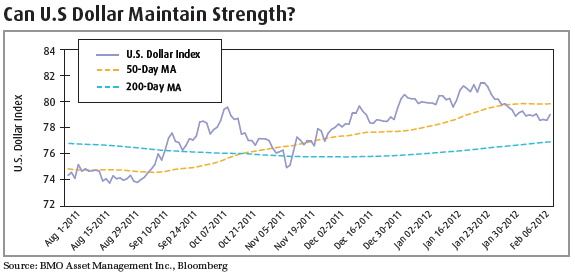
Greenback watch: The strength of the U.S. dollar will be key in determining whether commodities continue to outperform. Coming into the New Year, we anticipated the U.S. currency to strengthen through the first quarter as a number of central banks were accessing the U.S. dollar via the recently initiated swap lines designed to improve liquidity. However, the Fed’s recent announcement of its pledge to keep interest rates low until 2014 suggested lower relative interest rates in the U.S., causing commodities to rally over the last several weeks. Developments in the European debt situation will determine the future demand for the U.S. dollar as a move back towards a risk-off environment would bring the greenback strongly back in favour. Commodity currencies look short-term overbought, suggesting sell-offs could present buying opportunities in commodities. Recommendation: If commodities continue to rally, use pullbacks as an opportunity to build a small exposure in economically sensitive areas such as base metals. Investors may want to consider the BMO S&P/TSX Equal Weight Global Base Metals Hedged to CAD Index ETF (ZMT) with a trailing stop-loss order.
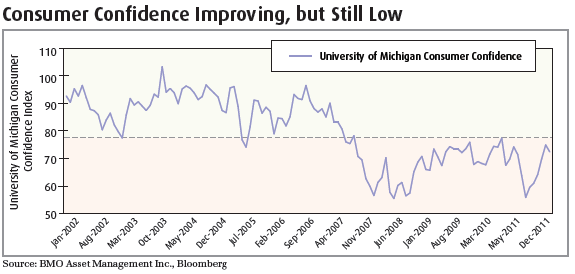
U.S. consumer confidence has improved... however the University of Michigan Consumer Confidence Index remains below its pre-credit crisis range. In many cases, U.S. economic data has come in better than expected this year, but consumer confidence must continue to improve in order to stimulate the business environment and thus the economy. Last month’s reading of 72.5 for February came in lower than expected and if this downtrend continues, equity markets could potentially sell-off. Given the economic instability that remains, even the most aggressive investors should retain some exposure to fixed income should the recent encouraging economic data stall. As the U.S. remains Canada’s main trading partner, economic activity south of our border will have a direct effect on ours. Recommendation: We continue to favour the mid-part of the yield curve given our expectations that the Bank of Canada (BoC) will likely keep interest rates unchanged for the time being. By taking some duration risk, investors can increase the yield in their portfolio. However, taking too much duration risk, such as overweighting the long-end of the curve, could put investors at risk as longer duration bonds have a tendency to sell-off when investor sentiment improves. Investors may want to consider the BMO Mid-Corporate Bond Index ETF (ZCM) and the BMO Mid-Federal Bond Index ETF (ZFM).
Footnotes
1 Long-Term Refinancing Operations (LTRO): a major financing method used by the European Central Bank to provide liquidity to its member banks. Although the operation has been in existence for well over a decade, its rules were recently revised to make it considerably easier for banks to obtain funding. First, through LTRO banks can now post collateral to borrow funds for three years rather than several months. Second, the eligible collateral to obtain funding has been relaxed significantly.
2 Tail-risk: The risk of an outlier or improbable event occurring. Statistically, the event is said to be three standard deviations away from the mean under
a normally distributed curve.
3 Golden-Cross: When a security’s 50-day moving average moves above its 200-day moving average, it is said to have entered a “golden-cross.” This is traditionally seen as a positive and potentially indicates a bull market on the horizon.
4 Beta: a measure of the tendency of a security or portfolio’s returns to respond to swings in the market. A beta of 1.0 indicates that the security’s price will move with the market, while a beta of less than 1.0 means that the security will be less volatile than the market and a beta of greater than 1.0 indicates that the security’s price will be more volatile than the market.


