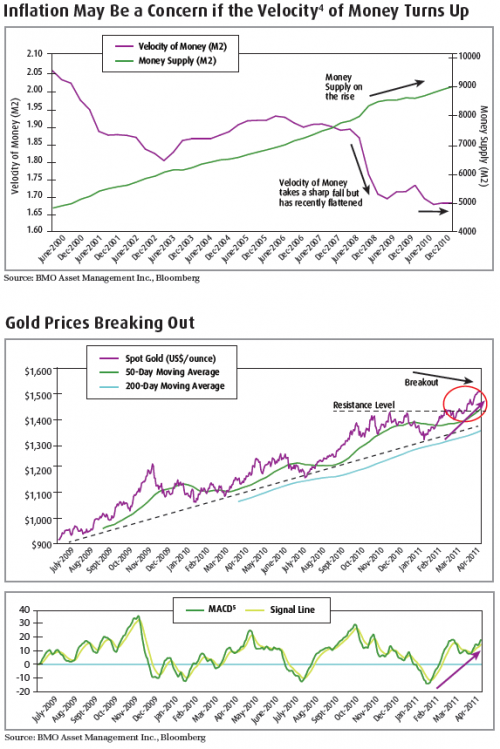
On a technical level, gold bullion recently broke the US$1450/ounce level which until April 2, 2011 acted as a resistance level. The recent uptick in fund flows to precious metals ETFs and ETPs around the world in the last two months should also help push gold prices higher. However, as we mentioned earlier in the year, we expect higher gold prices to come with higher volatility this year. Gold equities, particularly the juniors, have recently lagged. While it broke above its 50-day moving average, the Dow Jones North American Select Junior Gold Index has failed to break its resistance level of 6000. Nevertheless, we believe investors should have a diversified exposure to precious metals through bullion (or futures) and gold and silver related stocks in their portfolio.
Potential Investment Opportunity:
- BMO Precious Metals Commodity ETF (ZCP)
- BMO Junior Gold Index ETF (ZJG)
As correlation between stocks and asset classes are slowly but surely declining, we contend that investors should now begin looking at tactical asset allocation to potentially enhance their investment strategy’s risk/return profile. A core-satellite strategy is an approach to investing that readers may want to adopt as the strategic asset allocation mix will oblige investors to remain disciplined while the tactically managed portion will better position an investment strategy in a dynamic market.
Footnotes
1 CBOE Volatility Index (VIX): is a key measure of market expectations of near-term volatility conveyed by S&P 500 stock index option prices. Since its introduction in 1993, VIX has been considered by many to be the world’s premier barometer of investor sentiment and market volatility.
2 CBOE Implied Correlation (ICJ): The measure of co-movement between two variables as implied by the price of option contracts. Since option prices are “forward-looking” financial indicators that incorporate market expectations over the maturity of the option, they may provide interesting additional information not contained in the historical data.The S&P/CBOE Implied Correlation Index is an index that tracks the implied correlation of the individual stocks in the S&P 500 Index.
3 Bollinger Bands/Bollinger Bandwidth: A band potted two standard deviations above and below a simple moving average. Because standard deviation is a measure of volatility, Bollinger bands adjust themselves to the market conditions. When the markets become more volatile, the bands widen (move further away from the average), and during less volatile periods, the bands contract (move closer to the average).
4 Velocity of Money: Rate at which money circulates, changes hands, or turns over in an economy in a given period. Higher velocity means the same quantity of money is used for a greater number of transactions and is related to the demand for money. It is measured as the ratio of GNP to the given stock of money. Also called velocity of circulation.
5 Moving Average Convergence Divergence (MACD): A trend-following momentum indicator that shows the relationship between two moving averages of prices. The MACD is calculated by subtracting the 26-day exponential moving average (EMA) from the 12-day EMA. A nine-day EMA of the MACD, called the “signal line”, is then plotted on top of the MACD, functioning as a trigger for buy and sell signals.
Disclaimer:
Barclays Capital and Barclays Capital Inc. are trademarks of Barclays Capital and have been licensed for use in connection with listing and trading of BMO U.S. High Yield U.S. Corporate Bond Hedged to CAD Index ETF on the Toronto Stock Exchange. The BMO U.S. High Yield U.S. Corporate Bond Hedged to CAD Index ETF are not sponsored by, endorsed sold or promoted by Barclays Capital and Barclays Capital makes no representation regarding the advisability of investing in them.
Commissions, management fees and expenses all may be associated with investments in exchange traded funds. Please read the prospectus before investing. The funds are not guaranteed, their values change frequently and past performance may not be repeated.
Standard & Poor’s®, S&P® and S&P GSCI® are registered trademarks of Standard & Poor’s Financial Services LLC (“S&P”) and have been licensed for use by BMO Asset Management Inc. BMO Precious Metals Commodities Index ETF is not sponsored, endorsed, sold or promoted by S&P or its Affiliates and S&P and its Affiliates make no representation, warranty or condition regarding the advisability of buying, selling or holding units in the BMO Precious Metals Commodities Index ETF. This communication is intended for informational purposes only and is not, and should not be construed as, investment and/or tax advice to any individual. Particular investments and/or trading strategies should be evaluated relative to each individual’s circumstances. Individuals should seek the advice of professionals, as appropriate, regarding any particular investment.
BMO ETFs are administered and managed by BMO Asset Management Inc., a portfolio manager and a separate legal entity from the Bank of Montreal.
Copyright © BMO ETFs


