


Recent headlines tell a grim story about August’s record month of ETF outflows, but as usual there’s more to the story than the raw numbers suggest. Dodd Kittsley puts August’s flows in perspective – and explains how they offer insight into what investors are thinking these days.
by Dodd Kittsley, Blackrock iShares
A quick glance at headlines the last few days tell a grim story for ETFs. Numerous articles have reported “record outflows” and investors “fleeing ETFs” and so forth. But despite the dire stories, ETF flows in August were not as bad as they seem – and more importantly they offer valuable insight into what investors are thinking these days.
First, let’s put the flows in perspective. The global ETF industry did experience outflows of $15 billion in August – the second month of outflows this year, and the largest monthly outflow on record for ETFs. However, as the Wall Street Journal recently pointed out, records aren’t what they used to be. With ETF growth continuously on the rise, the denominator for these outflow months keeps getting bigger. For example, the second largest month of outflows on record, $13.4 billion in January 2010, represented 1.2% of total ETF industry assets, whereas last month’s $15 billion in outflows represented just 0.7%.
Still, a month of record outflows is notable, and not exactly surprising given all the uncertainty around economic growth, Federal Reserve policy and unrest in the Middle East. August redemptions were mostly driven by equity ETFs, which lost $9.4 billion, and in particular US equity ETFs, which lost $14.5 billion. Fixed income followed suit with $5.3 billion in outflows, including $8.1 billion in outflows from funds with longer maturity profiles.
At first glance, it would seem investors were taking a risk-averse stance by ditching stocks. But if you exclude significant flows out of the SPDR S&P 500 ETF (SPY), which was hit with $14 billion in redemptions, then total US equity outflows were modest at -$0.5 billion. In addition, there was some positive news on the equity front, with the Eurozone’s first economic expansion in 18 months driving European equity ETF flows to an all-time high of $4.7 billion.
This suggests that investors weren’t as risk-averse as higher-level data suggested. In fact, there is evidence that August actually experienced a significant increase in risk sentiment. As you can see below, the BlackRock Equity Risk Sentiment Measure* rose to a 10-month high in August, despite the fact that there were equity outflows.
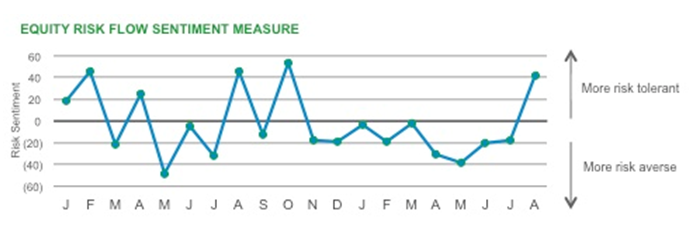
Because the Risk Sentiment Measure takes into account the risk profiles of securities within a category, it reflects shifts in risk appetite that are harder to discern from raw flow data. In other words, in August there were net outflows in less risky equity ETFs (e.g. broad-based, large cap funds like SPY) and net inflows in riskier equity ETFs (e.g. European equity funds).
The primary takeaway, as always, is that there’s usually more to the story than what high-level flows illustrate. It’s often necessary to look at both raw flow data and other information, like the BlackRock Risk Sentiment Measure, to get a more accurate picture of emerging investor trends.
In the case of August flows, investors appeared to be cautiously optimistic while also likely preparing for increased market volatility come September. With events like the highly-anticipated FOMC meeting, German elections, US debt ceiling negotiations and the escalating conflict in Syria, the only thing certain about September is all the uncertainty.
Dodd Kittsley, CFA, is the Head of Global ETP Market Trends Research for BlackRock and a regulator contributor to the The Blog. You can find more of his posts here.
Sources: BlackRock, Bloomberg
* BlackRock Risk Sentiment Measure Methodology: The measure is computed by asset class (e.g., Equity, Fixed Income) and for different time periods (weekly, monthly, etc.) to reflect shifts in risk appetite that are harder to discern from raw flow data. To compute risk sentiment within a particular asset class, we sort ETPs into two groups, high and low risk, based on their 60-day realized return volatility. Risk sentiment is then defined as the total dollar inflows/outflows for the riskier group of ETPs less those of the safer group, scaled by the dispersion in flows across the sample. Zero on the scale below represents the 1-year moving average. It’s important to note the BlackRock Risk Sentiment Measure considers risk sentiment excluding cash.
Information on SPY is provided strictly for illustrative purposes and should not be deemed an offer to sell or a solicitation of an offer to buy shares of the Fund.
Copyright © Blackrock Blog