by Ryan Detrick, LPL Research
What a year it has been—so far! While anxieties mount, global equity prices remain at or near all-time highs. Per Ryan Detrick, “2017 has so far been one of the least volatile years we’ve seen in decades. However, boring isn’t always a bad thing, as some of the markets’ best performances took place amid very low volatility.”
Here are some key takeaways from the S&P 500 Index’s first-half performance:
- The S&P 500 made 24 new highs, the most since 35 during the first six months of 1998.
- The S&P 500 was up on a total return basis in each of the first six months of the year. The last two times this occurred (1995 and 1996), the index gained an additional 14.4% and 11.7% over the final six months of the year, respectively.
- Early strength is nothing new for this bull market, as the index has been higher year to date at the end of June in each of the last seven years, matching the previous record from 1985 to 1991.
- Again, on a total return basis, the index gained eight consecutive months for the first time since a streak ended in May 2011. Since 1990, the all-time record was 10 months, which ended in October 1995.
- The index closed up or down at least 1% only four times during the first half of the year. The last time that occurred was 1972, with only three instances. The record was in 1964 with only one, and the most was in 1932 with 91.
- The largest pullback was only 2.8% (March 1 until April 13) and that was the second-smallest first-half pullback ever (1995 at 1.7% is the record). The average first-half pullback has been 9.0% since 1950, making the action in 2017 all the more remarkable.
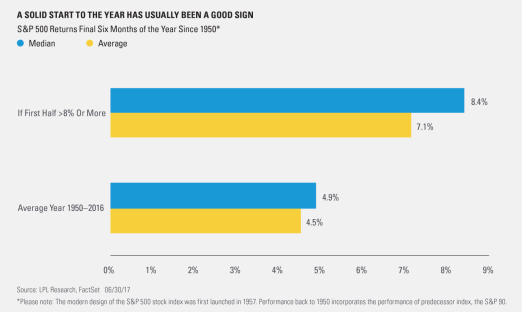
- The index was up 8.2% for the first half of the year (double the 4.1% average first-half return since 1950*). What happens now? Since 1950*, the second half of the year has been up 4.5% on average and higher 70.1% of the time. However, in the 25 other instances when the first half has been up more than 8% (like 2017), the second half return has been even stronger with an average 7.1% gain and positive returns 84.0% of the time (higher 21 out of 25 times). In other words, strength usually begets strength, and we believe a large second-half pullback is unlikely.
- July has tended to see a summer bounce, but it has usually been surrounded by weakness in May-June and August-September. Of course, so far this year, 2017 has broken many of the previous “usually happens” that we’ve seen historically, and we didn’t see much weakness in May or June.
IMPORTANT DISCLOSURES
* Please note: The modern design of the S&P 500 stock index was first launched in 1957. Performance back to 1950 incorporates the performance of predecessor index, the S&P 90.
Past performance is no guarantee of future results. All indexes are unmanaged and cannot be invested into directly. The opinions voiced in this material are for general information only and are not intended to provide or be construed as providing specific investment advice or recommendations for any individual security.
The economic forecasts set forth in the presentation may not develop as predicted.
Investing in stock includes numerous specific risks including: the fluctuation of dividend, loss of principal and potential illiquidity of the investment in a falling market.
Stock investing involves risk including loss of principal.
The Standard & Poor’s 500 Index is a capitalization-weighted index of 500 stocks designed to measure performance of the broad domestic economy through changes in the aggregate market value of 500 stocks representing all major industries.
The S&P 500 is an unmanaged index which cannot be invested into directly. Past performance is no guarantee of future results.
This research material has been prepared by LPL Financial LLC.
To the extent you are receiving investment advice from a separately registered independent investment advisor, please note that LPL Financial LLC is not an affiliate of and makes no representation with respect to such entity.
Not FDIC/NCUA Insured | Not Bank/Credit Union Guaranteed | May Lose Value | Not Guaranteed by any Government Agency | Not a Bank/Credit Union Deposit
Securities and Advisory services offered through LPL Financial LLC, a Registered Investment Advisor Member FINRA/SIPC
Tracking # 1-622489 (Exp. 6/18)


