The Stock market’s FINAL FOUR Factors
by Burt White, CIO, LPL Financial
The NCAA College Basketball Final Four is set. Gonzaga, North Carolina, Oregon, and South Carolina are headed to Phoenix, Arizona to determine this year’s college basketball national champion. In that spirit, following our “Sweet 16” commentary last week, this week we share our “Final Four Factors” for the stock market in 2017: 1) economic growth, 2) earnings, 3) corporate tax reform, and 4) the Federal Reserve (Fed). We expect a hard-fought battle between these factors and market risks, including a policy mistake from a government or central bank, trade protectionism, and geopolitics.

FACTOR #1: Economic Growth
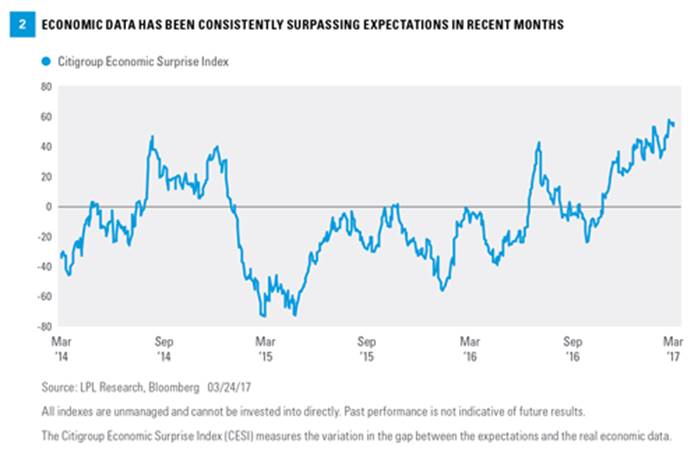
We continue to expect near 2.5% growth in U.S. gross domestic product (GDP) in 2017, roughly in line with long-term averages and slightly above Bloomberg’s consensus (2.2%). We expect economic growth to be supported by improving business investment, steady consumer spending gains, and, later in the year, pro-growth fiscal policy. Our favorite leading indicators, including the just-released Leading Economic Index (LEI) from the Conference Board, the Institute for Supply Management (ISM) Manufacturing Index, and the yield curve, suggest a low probability of recession over the next 12–18 months. Domestic economic data have broadly surprised to the upside in recent months, as illustrated by the Citigroup Economic Surprise Index [Figure 2], which measures the mix of economic data coming in above versus below economists’ forecasts. Overseas data are improving as well.
The economic growth we expect provides a favorable backdrop for stock market performance as we highlighted in our Outlook 2017: Gauging Market Milestones. Since WWII, in years when the U.S. economy does not enter recession, the S&P 500 Index has produced an average annual gain of 12%. Also note that the best stock market performance has come when GDP is growing 2-4% (+12.1% average S&P 500 gain), rather than rapid growth of over 4% (+9.6%) or modest growth of below 2% (+0.3%), based on the past 50 years of historical data.
Bottom line: We expect a moderate pickup in economic growth in 2017 may help to provide a favorable backdrop for U.S. stocks over the balance of the year.
FACTOR #2: Earnings
The fortunes of this “Final Four Factors” have changed a lot over the past year. A year ago at this time, we were in the heart of an earnings recession. Companies faced a challenging global economic environment including an embattled energy sector in the midst of a historic downturn, a strong and rising U.S. dollar, and fears of an Asian currency crisis. Turning to today, the earnings recession is over, S&P energy sector earnings are growing again, and the U.S. dollar has stabilized. S&P 500 earnings for the fourth quarter of 2016 rose 8% year over year. Consensus expectations on corporate earnings are calling for near 10% year-over-year growth in 2017 based on Thomson Reuters estimates.
A number of factors are supporting earnings in the U.S., including the strong February reading for the ISM Manufacturing Index. We believe economic growth is on the upswing in the U.S. and globally. Oil prices have remained relatively stable at prices far above 2016 lows. The U.S. dollar has stabilized at lower levels and is not expected to be much of a drag on earnings this year. Forward estimates in recent months have held up better than they have historically, increasing our confidence that solid earnings gains may be achieved. And corporate profit margins for S&P 500 companies outside of energy have remained resilient, despite some labor cost pressures that are to be expected in the eighth year of an economic expansion. Finally, pro-growth policies out of Washington, D.C. may give earnings a lift in late 2017 or early 2018, including corporate tax reform (more on that next).
Bottom line: We expect high-single-digit S&P 500 earnings growth in 2017 to potentially drive further, though modest, gains for stocks. Earnings growth may be supported by better U.S. economic growth, rebounding energy sector profits, a stable U.S. dollar, and resilient profit margins.

FACTOR #3: Corporate Tax Reform
Corporate tax reform remains the centerpiece of President Trump’s economic agenda and, despite the failed attempt to get an Affordable Care Act (ACA) replacement bill through the House last week, is still likely to get done at some point in the next year. Bringing the rate down should help boost economic growth, stimulate corporate investment, reduce incentives for U.S. companies to move offshore, and perhaps most important for stock market investors, lift corporate profits — some estimate by 10% or more.
Because of the importance of the tax overhaul to markets, Trump’s immediate pivot to taxes on Friday (March 24) should be welcomed by market participants (and last week’s S&P 500 losses may be attributable to healthcare’s implications on the rest of the Trump agenda). Getting tax reform done will be easier than healthcare because there is more widespread agreement on what is needed. However, tax reform is also very complicated and, given a fractured Congress, varied special interests, and lost political capital, may be a bumpy ride.
Bottom line: It is positive for markets that Trump and his team will immediately shift from healthcare to corporate tax reform where agreement is more widespread. But comprehensive tax reform will still be difficult to achieve; plans may need to be scaled back and could take longer than expected (into early 2018).
FACTOR #4: Federal Reserve
We expect the Fed to hike interest rates twice more in 2017 following the Federal Open Market Committee’s (FOMC) rate hike on March 15, 2017. We are encouraged by the Fed’s acknowledgement of the improved economic outlook and its stated plan to hike rates gradually, which should help the stock market weather the moves. That said, while a better growth outlook may help stocks shrug off rate hikes, the possibility still exists that the Fed could spook the markets by speeding up its timetable.
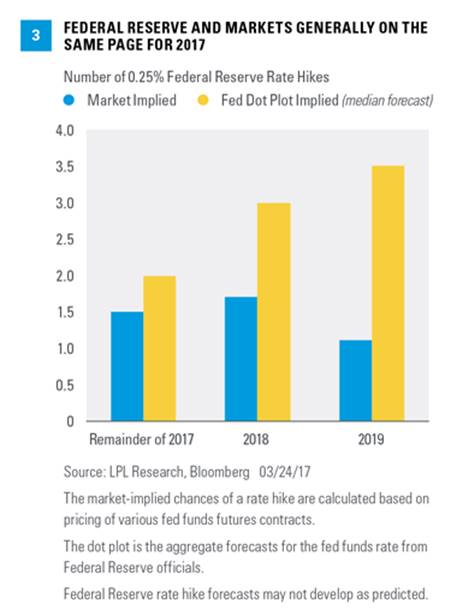
Recall early last year, stocks suffered a bout of volatility in part because the markets and the Fed were not on the same page with regard to the potential path of rate hikes. The divergence — with the Fed forecasting four hikes as 2016 began while markets were skeptical of more than one (based on fed fund futures) — contributed to the imbalances that wreaked havoc on global markets in January and February of 2016.
This year, the Fed and markets are much closer to being on the same page [Figure 3]. The fed funds rate is implying a 50% chance of two more rate hikes this year of 0.25% each, whereas collective forecasts for FOMC members imply two more hikes of 0.25% in 2017. The gap is wider for 2018, but the difference is not much more than one 0.25% hike.
Bottom line: We expect two more rate hikes in 2017. We are encouraged by the Fed’s acknowledgement of the improved economic outlook and its stated plan to hike rates gradually, which should help the stock market weather the moves.

Possible upsets
This tournament has offered several upsets, including early exits for Duke and Villanova. For stocks, we would suggest policy optimism introduces the potential for an upset. We believe a good portion of the stock rally since Election Day has been driven by optimism around Trump and the Republican-led Congress being able to implement pro-growth policies including tax reform, as well as deregulation and infrastructure spending. The market volatility last week around the healthcare effort in Washington, D.C. underscores the risk to markets if this agenda gets knocked off track.
Other potential “upsets” include the aforementioned potential for an overly aggressive Fed, protectionist trade policies, and geopolitical risk, including European elections that could lead to increased risk of a breakup of the Eurozone (not our expectation) and a major global terrorist event.
Conclusion
There you have it — our “Final Four Factors” for the stock market in 2017: economic growth, earnings, corporate tax reform, and the Fed. We believe it will be a hard-fought battle between these factors and market risks, but when the tournament ends on December 31, 2017, we expect the S&P 500 to be at or above current levels, depending on the policy path.
*****
IMPORTANT DISCLOSURES
The opinions voiced in this material are for general information only and are not intended to provide specific advice or recommendations for any individual. To determine which investment(s) may be appropriate for you, consult your financial advisor prior to investing. All performance referenced is historical and is no guarantee of future results.
The economic forecasts set forth in the presentation may not develop as predicted and there can be no guarantee that strategies promoted will be successful.
This information is not intended to be a substitute for specific individualized tax advice. We suggest that you discuss your specific tax issues with a qualified tax advisor.
Investing in stock includes numerous specific risks including: the fluctuation of dividend, loss of principal, and potential liquidity of the investment in a falling market.
All investing involves risk including loss of principal.
Because of its narrow focus, investing in a single sector, such as energy or manufacturing, will be subject to greater volatility than investing more broadly across many sectors and companies.
DEFINITIONS
Gross Domestic Product (GDP) is the monetary value of all the finished goods and services produced within a country’s borders in a specific time period, though GDP is usually calculated on an annual basis. It includes all of private and public consumption, government outlays, investments and exports less imports that occur within a defined territory.
The Citigroup Economic Surprise Indices are objective and quantitative measures of economic news. They are defined as weighted historical standard deviations of data surprises (actual releases vs Bloomberg survey median). A positive reading of the Economic Surprise Index suggests that economic releases have on balance [been] beating consensus. The indices are calculated daily in a rolling three-month window. The weights of economic indicators are derived from relative high-frequency spot FX impacts of 1 standard deviation data surprises. The indices also employ a time decay function to replicate the limited memory of markets.
The Institute for Supply Management (ISM) Index is based on surveys of more than 300 manufacturing firms by the Institute for Supply Management. The ISM Manufacturing Index monitors employment, production inventories, new orders, and supplier deliveries. A composite diffusion index is created that monitors conditions in national manufacturing based on the data from these surveys.
The Index of Leading Economic Indicators is a monthly publication from the Conference Board that attempts to predict future movements in the economy based on a composite of 10 economic indicators whose changes tend to precede changes in the overall economy.
The Standard & Poor’s 500 Index is a capitalization-weighted index of 500 stocks designed to measure performance of the broad domestic economy through changes in the aggregate market value of 500 stocks representing all major industries.
Copyright © LPL Financial


