The Huddle: Using PE = Growth to Identify Entry Points For
by Bob Simpson, Synchronicity Performance Consultants
The past 12-months have been difficult for investors. We have transitioned from a market in which a high percentage of company earnings have been growing at high rates and price earnings multiples have been expanding (best of both worlds) to a market where some companies continue to grow and others have seen earnings decline and contraction of P/E multiples.
Let’s take a look at a Home Depot (HD)
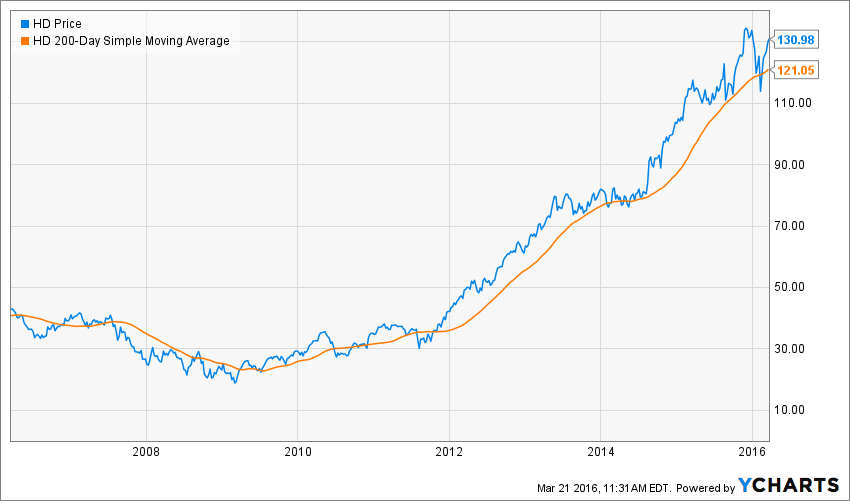
Prices show us a sharp drop in the price of HD, which broke down through the 200 day moving average and probably triggered some stops for those using this indicator.
HD has subsequently bounced back and is now challenging its highs. Let’s look inside the price and technical numbers.
Most advisors use price earnings multiple as a method of determining if a stock is over or under valued but the P/E ratio only tells part of the story. Should two companies with very different earnings growth rates deserve the same P/E multiple?
Let’s turn our attention to the PEG ratio. A PEG ratio is calculated by dividing the P/E Ratio by the EPS Growth Rate for a specific period of time. One way to use this is to look at a range of EPS growth rates (1 year, 3 years and 5 years) and compare that to the P/E ratio. A measuring stick that you might consider is PE = G or P/E ratio equals the EPS growth rate of a company.
HD has been growing earnings per share at a rates of:
- 1 year 15.89%
- 3 years 22.09%
- 5 years 22.12%
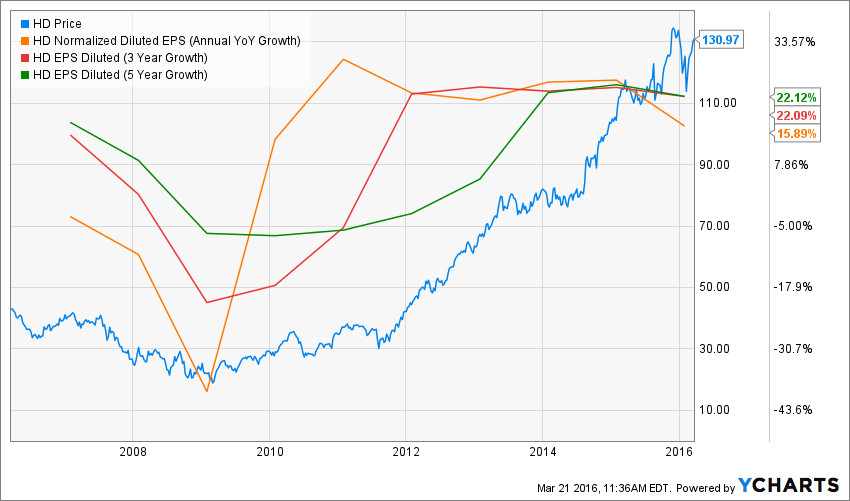
Not only has HD been able to achieve these high growth rates but they have been able to maintain them since 2011. So based on this, a P/E multiple within this range would be quite acceptable (15.89% to 22.12%).
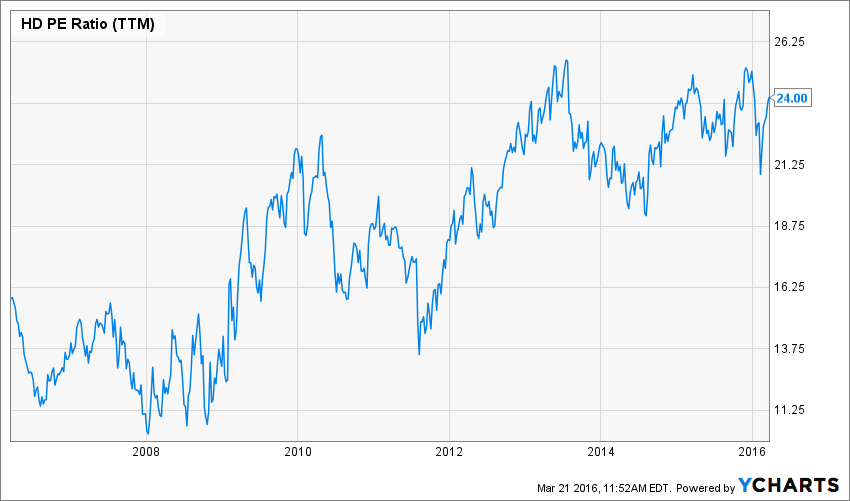
As earnings growth kicked in, the price earnings multiple for HD has expanded from 13.75 to a high of about 25 times earnings. Based on PE=G, HD is a bit expensive.
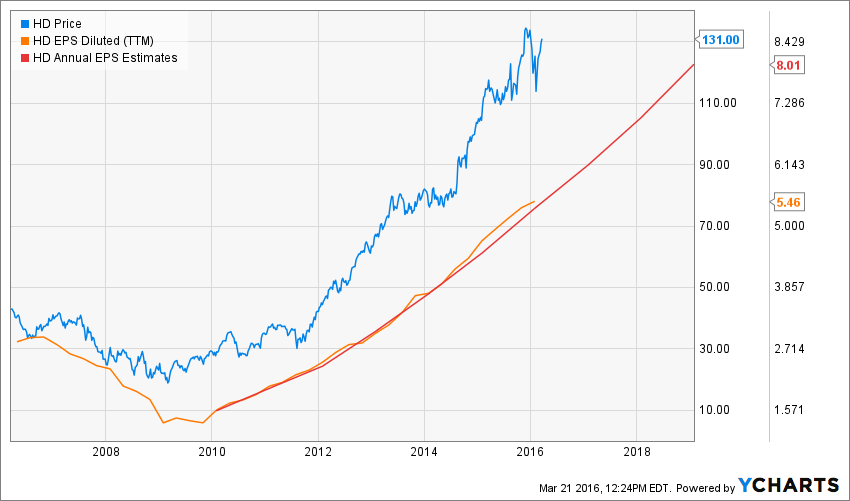
In the next chart, we are going to look at analyst estimates for the next 12-months:
NASDAQ.com Consensus EPS Forecast calls for HD earnings to be:
Jan 2017 6.18
Jan 2018 6.98
Jan 2019 7.86
Jan 2020 8.64
Source: http://www.nasdaq.com/symbol/hd/earnings-forecast
If HD hits its Jan 2017 estimate and trades at the 5-year growth rate of 22.12% (P/E 22.12), the stock should trade at $136 in 2017 which compares to the current price of $131. As the stock is fully valued based on P/E, return over the next one to three years is largely dependent on earnings growth as there is a low probability of P/E expansion.
To identify companies where growth rates exceed the price earnings multiple, you can easily scan to identify candidates.
For more examples, watch the recording of The Huddle for March 21, 2016.


