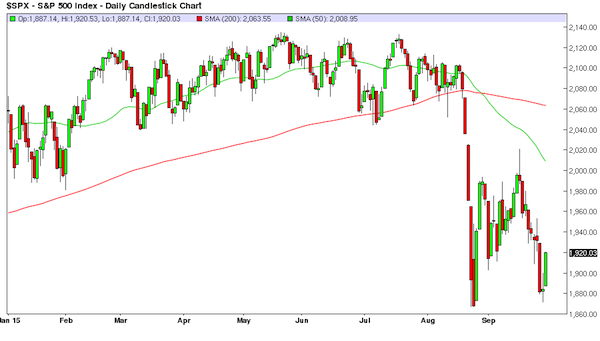
Are there signs of a potential market crash in the data?
by Brad McMillan, CIO, Commonwealth Financial Network
In a continuation of my post from yesterday, I am not aware of any single indicator that can tell us when a market crash will occur. (I wish I were!) So, what I have done is reviewed previous significant market downturns and determined some common contributory factors that make sense in theory, as well as empirically.
Identifying past downturns
The following chart shows the change, year-on-year, in the S&P 500 Index and provides a nice summary of declines over the past 40 years. If we limit our view to instances when the decline was greater than 20 percent or so, we get the following periods:
- 1983–1984
- 1987
- 2000–2001
- 2008–2009
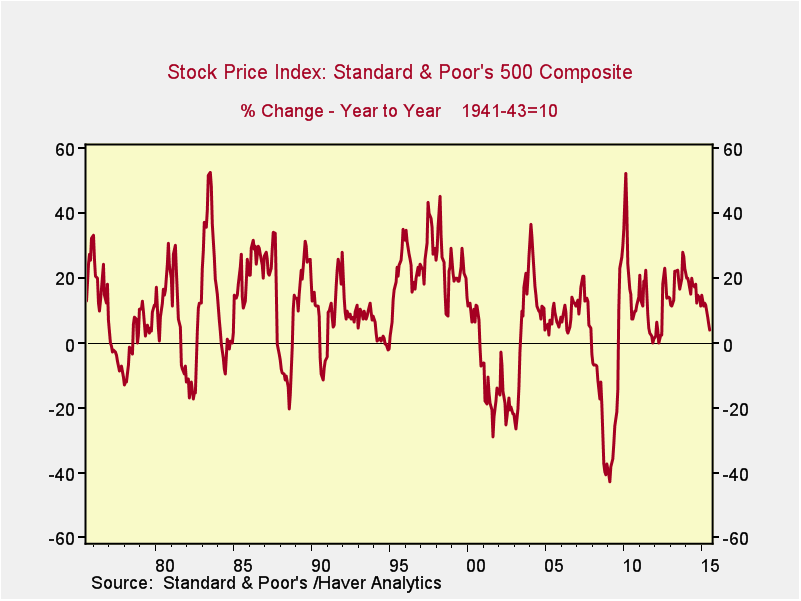
This is a pretty good sample, so let’s take a look at some potential factors that may have contributed to each market crash. Today, I’ll focus on market-based indicators, and tomorrow I’ll take a look at more general gauges. Next week, I’ll combine them to see what the ensemble indicates about the near future of the market.
Valuation changes
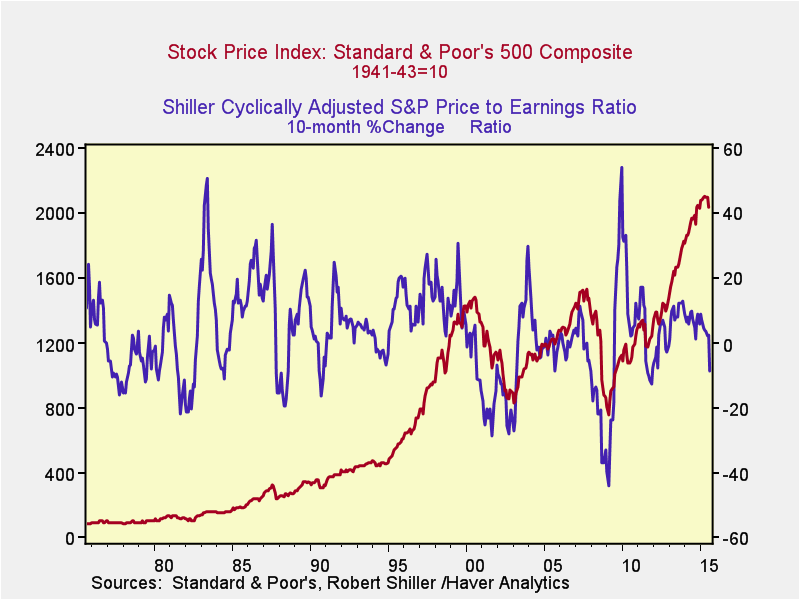
In theory, changes in how investors value the market should show up in actual prices, and the change in investor opinion should precede that price change. The following chart is not all that clear, but the point I want to make is that, for the two events we can see most clearly (2000 and 2008), the rate of change of the Shiller P/E did start declining well before prices dropped the most on a year-to-year basis. You can also see this, although less clearly, in 1983 and 1987. That said, there have also been false alarms, such as in 2004—and for the past couple of years.
Even so, with the growth rate of the Shiller P/E moving into negative territory in recent months, this metric seems to suggest that a sharper decline is possible.
Margin debt in the markets
Typically, as markets rise, people borrow more and more until the bubble pops, and they have to sell to pay their loans. We should therefore, in theory, be able to track spikes in margin debt and use that as an indicator for a potential crash.
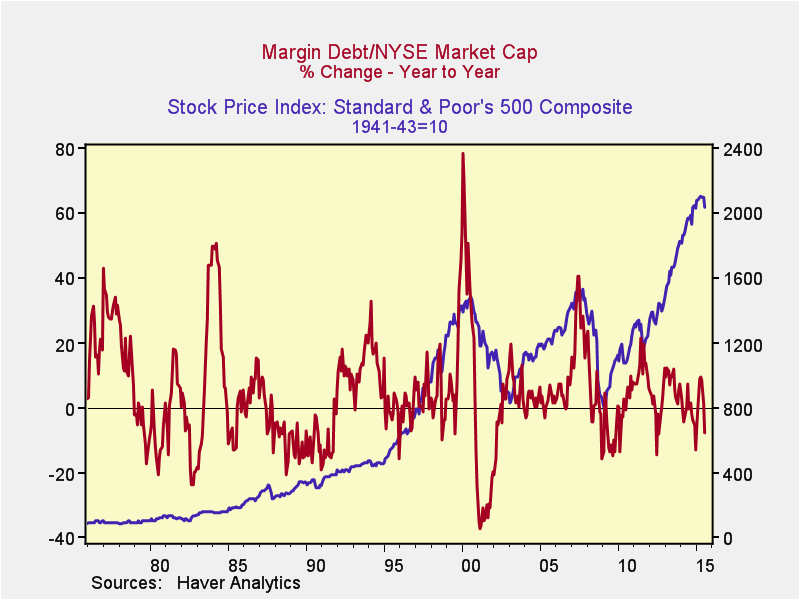
In practice, the relationship is less clear cut. Although we did see spikes in margin borrowing in 2000 and 2008, which collapsed before the market dropped, recently we have seen a slow decline in the growth rate of debt, rather than a spike.
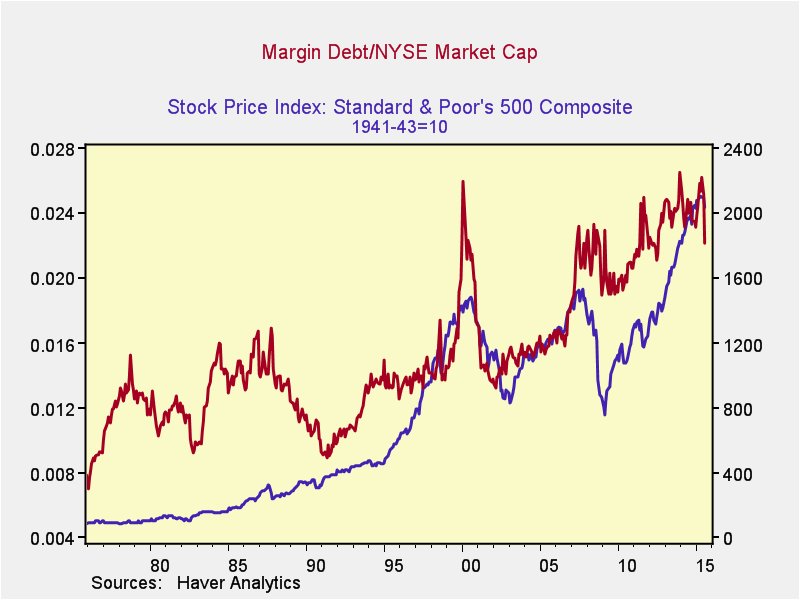
In fact, in absolute terms, margin debt has topped out and started to decline, even as the market has pulled back. This indicator seems to show that while margin debt remains high, the market has not seen the kind of spiked borrowing that in the past led to a large correction.
The Buffett indicator
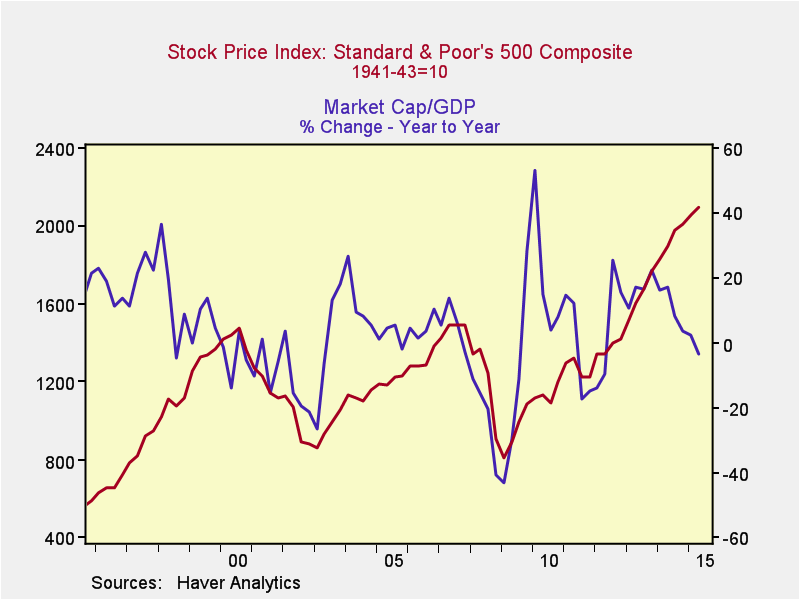
The final market indicator today is the change in the ratio of market capitalization to GDP—an indicator favored by Warren Buffett. If investors are optimistic, in theory, they will bid up stocks to a higher level, but a change in that optimism will show up before a significant price decline.
Looking at the past 20 years, we can see that a drop in the annual change of the market cap-to-GDP ratio to below zero did precede the declines in 2000 and 2008. As we are moving into a similar scenario right now, this suggests that a significant decline is possible. Earlier periods are less predictive, but the relationship remains.
Alert readers will note that these metrics show up in the Bubble Trouble post, last updated a couple of months ago. This is deliberate—warning indicators can, hopefully, be used in a proactive way as well.
The picture remains unclear
So, what have we got? A mixed set of indicators, based on the market, and while they are suggestive, they are not sufficient on their own to determine whether we’ll see another market crash. Tomorrow, therefore, we will look at a broader array of warning signs to try to get a clearer picture.
The S&P 500 Index is a broad-based measurement of changes in stock market conditions based on the average performance of 500 widely held common stocks.
Copyright © Commonwealth Financial Network


