by Don Vialoux, EquityClock.com
Pre-opening Comments for Tuesday October 21st
U.S. equity index futures were higher this morning. S&P 500 futures were up 9 points in pre-opening trade.
Index futures were helped partially by better than expected third quarter results from Apple and partially by better than expected third quarter GDP growth reported by China. Consensus for China’s GDP growth was an annualized gain of 7.2%. Actual was 7.3%.
Third quarter reports continue to stream in. Companies that reported after the close yesterday included Apple, Canadian Pacific, Chipotle, Coca Cola, Harley Davidson, Illinois Tool Works, Kimberly Clark, Lexmark, McDonalds, Omnicom, Reynolds, Texas Instruments, Travelers, United Technologies, Verizon and Zions Bancorp
Consolidated Edison (ED $61.46) is expected to open lower after Morgan Stanley downgraded the stock from Equal Weight to Underweight. Target is $55.
News Corp added $0.19 to $14.90 after Macquarie upgraded the stock from Underperform to Neutral. Target is $16.70
EquityClock.com’s Daily Market Comment
Following is a link:
http://www.equityclock.com/2014/10/21/stock-market-outlook-for-october-21-2014/
StockTwits Yesterday
Surprising quiet technical action by S&P 500 stocks to 10:30 AM EDT. No S&P 500 stocks broke resistance and one stock broke support: IBM.
Technical Action by Individual Equities
By the close, two S&P 500 stocks had broken resistance: L Brands and CH Robinson. No additional S&P stocks broke support.
Tech Talk/Horizons Weekly ETFs Market Sector Technical Scorecard Report
Following is a link:
http://www.horizonsetfs.com/campaigns/TechnicalReport/index.html
Tech Talk/Horizons Alert forwarded yesterday morning
 |
|
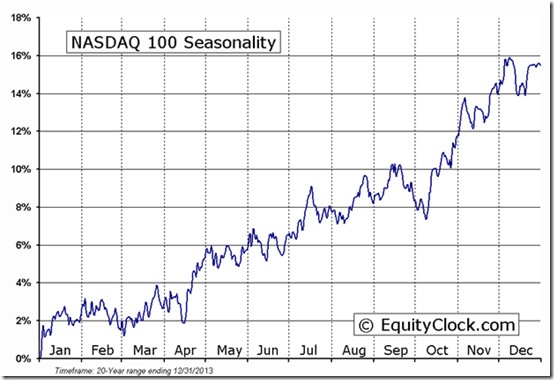
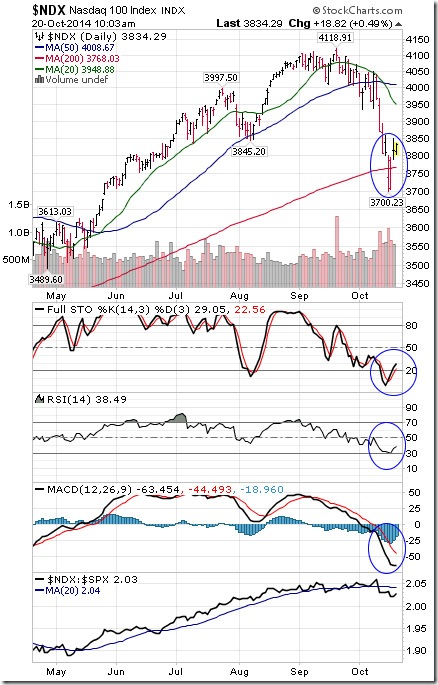
| Technical Seasonal Alert for Horizons ETFs October 20, 2014 Events: The NASDAQ 100 Index has just entered into a period of seasonal strength supported by an improving technical profile Horizons products expected to be positively influenced by the event: HQU Seasonal Influences The optimal period of seasonal strength for the NASDAQ 100 Index is from mid-October to the end of January. Technicals The NASDAQ 100 Index has a mixed but improving technical profile. Intermediate trend is neutral and strength relative to the S&P 500® Index currently is negative. However, the Index bounced last week from near its 200 day moving average and its short term momentum indicators (Stochastics, RSI and MACD) show signs of bottoming from oversold levels. Fundamentals The Index responds to anticipation of seasonal strength in fourth quarter revenues and earnings by its technology component triggered by sales of consumer electronic goods during the Christmas season. Prospects for strong consumer electronic goods sales this year are exceptional due to the wide variety of new products that have come to market before Christmas this year (e.g. iPhone 6). Comments, charts and opinions offered in this report by www.timingthemarket.ca and www.equityclock.com are for information only. They should not be considered as advice to purchase or to sell mentioned securities. Data offered in this report is believed to be accurate, but is not guaranteed. Don and Jon Vialoux are Research Analysts with Horizons ETFs Management (Canada) Inc. All of the views expressed herein are the personal views of the authors and are not necessarily the views of AlphaPro Management Inc. and Horizons ETFs Management (Canada) Inc., although any of the recommendations found herein may be reflected in positions or transactions in the various client portfolios managed by AlphaPro Management Inc. and Horizons ETFs Management (Canada) Inc. |
Interesting Charts
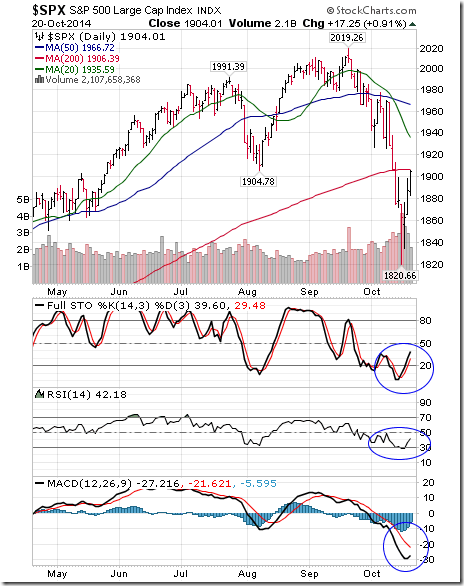
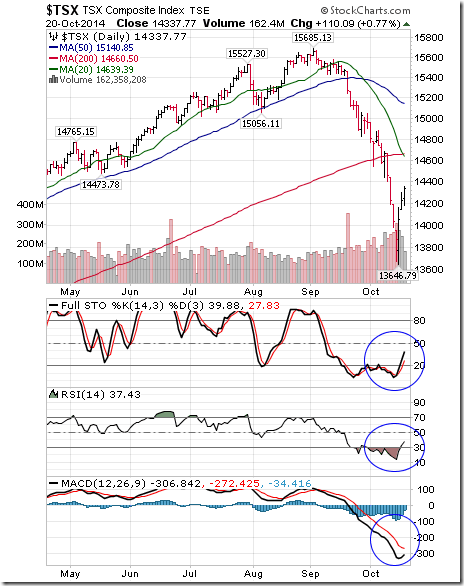
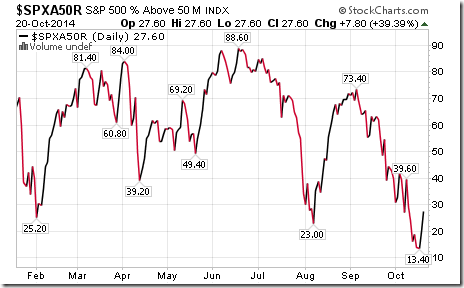
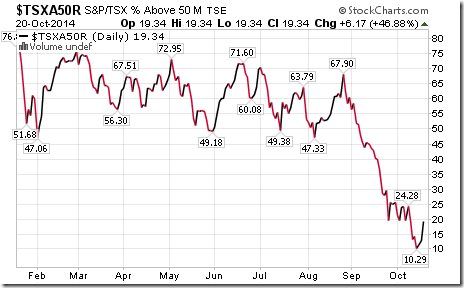
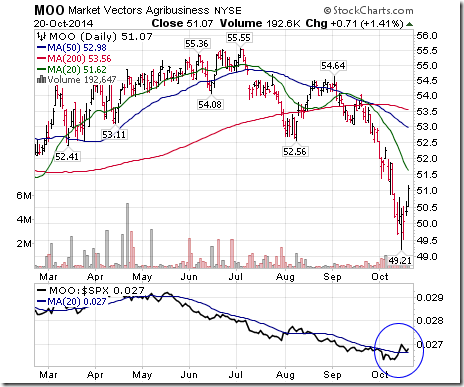
Short term momentum indicators for broadly based U.S. and Canadian equity indices have started to trend higher.
Percent of stocks trading above their 50 day moving average continues to recover from deeply oversold levels.
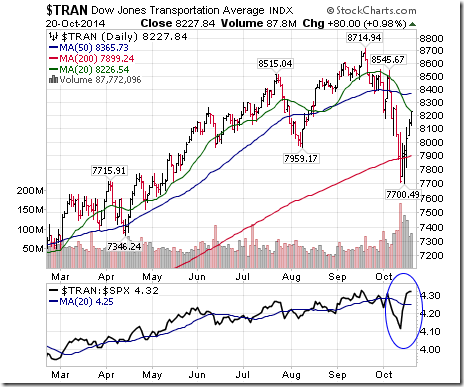
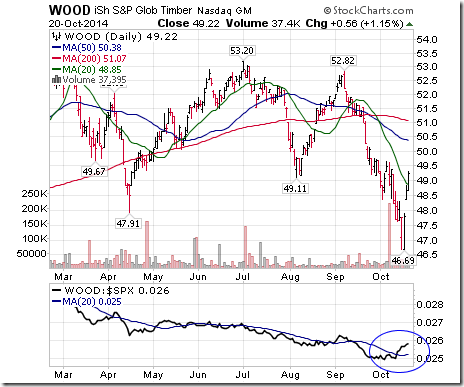
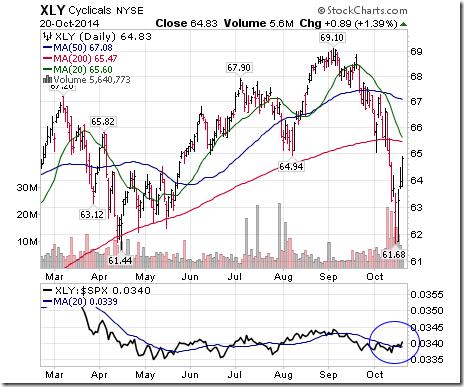
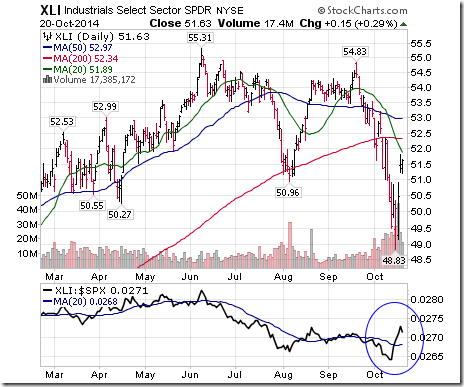
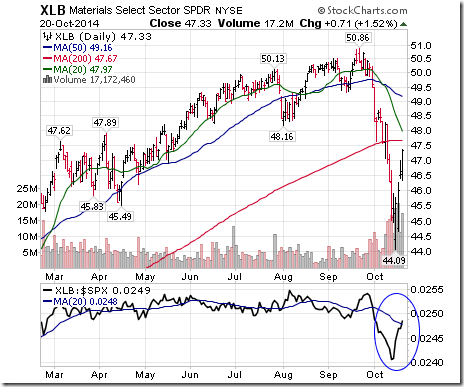
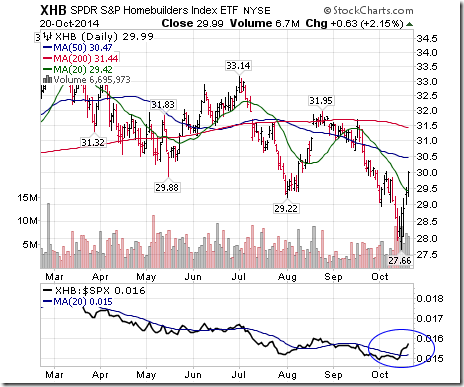
Economic sensitive sectors that have just entered their period of seasonal strength are starting to out-perform the S&P 500 Index, a positive sign indicating that an intermediate low for equity markets for the season has been reached.
Special Free Services available through www.equityclock.com
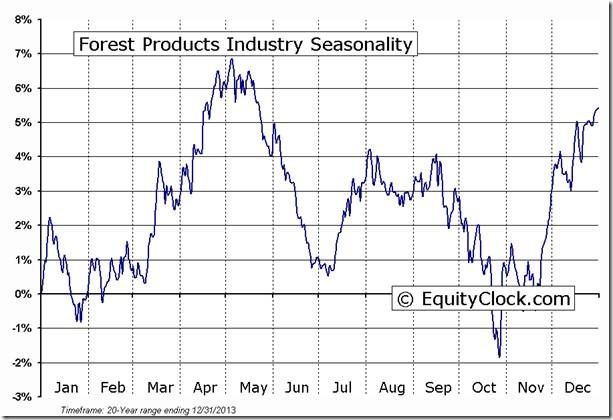
Equityclock.com is offering free access to a data base showing seasonal studies on individual stocks and sectors. The data base holds seasonality studies on over 1000 big and moderate cap securities and indices. To login, simply go to http://www.equityclock.com/charts/
Following is an example:
Monitored List
Economic sensitive equities with a technical score of 2.0 or higher that recently entered their period of seasonal strength are top candidates given improving technical for U.S. and Canadian equity markets. They were identified in yesterday’s Tech Talk and EquityClock.com’s report. It’s time to add selected stocks to the Monitored List. They include CAE.TO, CFP.TO, WFT.TO, CHRW, DHR, MON, PCL, QLGC, SRCL, XLNX, AAPL. More information (including technical scores) will be offered in tomorrow’s Tech Talk.
Tuesday, October 21, 2014
If you like to receive bi-monthly newsletter or know more about our model portfolios and investment philosophy or know what our portfolio cash levels are please complete the form at http://www.castlemoore.com/investorcentre/signup.php.
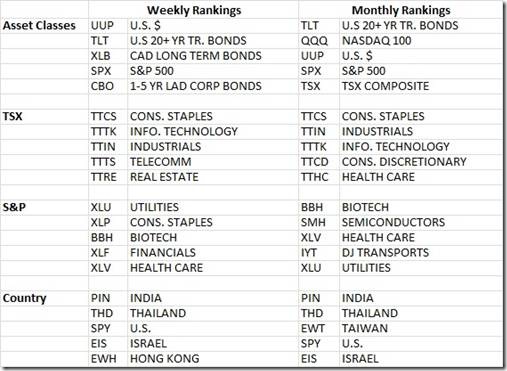
TOP ASSET 5 CLASSES, SECTORS AND COUNTRY HEAT MAPPING
Comments
With this being a mid-month analysis only the weekly data is new. There we see a continuation of a clear shift to defensive themes. In the Asset Class rankings for example 3 of the top 5 are bonds. In the TSX and S&P its utilities, consumer staples, telecom and healthcare reflecting this. In the Country rankings India, Thailand, US, Israel, Hong Kong (China) and Taiwan (China) are showing stability. Rankings do not anticipate market action they show what is persisting. Accordingly, we do not know yet if the moves towards defensive assets, sectors or countries are short term based on weakening data, including corporate guidance, or if there is persistence in them now especially that some are ranking high on both mid and longer term timeframes.
CHARTS of the WEEK
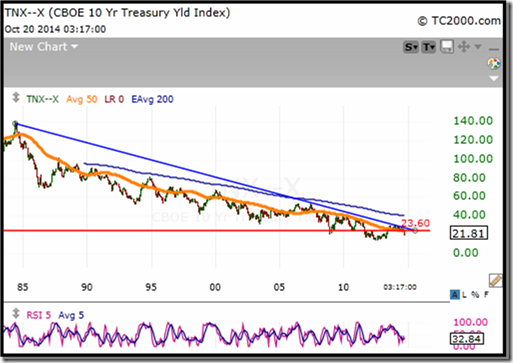
Rates
Bonds are a little more loved after the plunge down last week to sub-2.00% on the US 10 year (shown). The spike move down to 1.86% appears to be a blow-off, in this case to the down side in yields, though as indicated above in the asset section, a true gauge of the direction of rates in the mid-term will be determined by economic data and corporate earnings guidance. At present the long term trend in bonds is clearly in place despite the numerous calls of the death of fixed income. Asset allocation portfolios = a 30% weighting
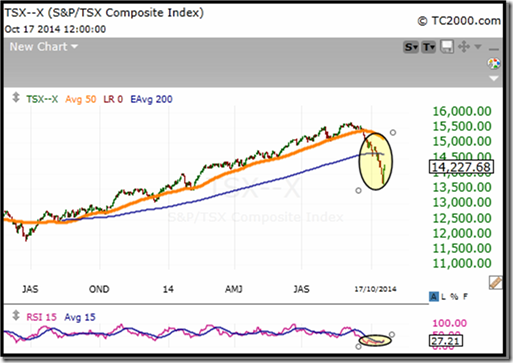
TSX Composite Index
The TSX, until it’s proved otherwise, is reflecting a global slowdown. While some commentators suggest oil’s move down was about oversupply, not demand, base metals cannot say the same thing. TSX index valuations appear compelling nonetheless.
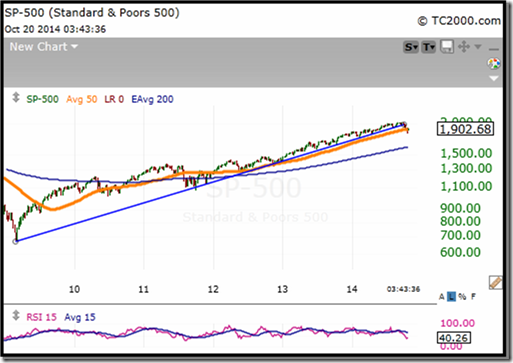
S&P 500 Index
The S&P is facing its biggest test since 2011. Like then, some portion of the weakness can be attributed to the end of a government stimulus program. However, the case can be made that we have seen the peak in corporate earnings and GDP growth, whether in part due to stimulus, or organically, or some combination of both. With the defensive sectors strong on both ranking timeframes investor positioning is suggesting a slowdown.
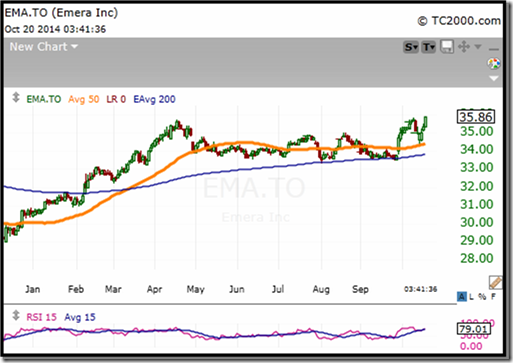
Emera Inc.
Emera, a Canadian utility holding of one of CastleMoore’s portfolio types is reflecting a slower growth environment with its recent break out to new highs. A long base is seen from May to October.
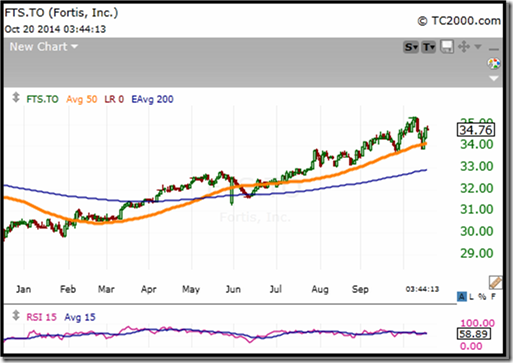
Fortis Inc.
Fortis, a utility holding across our asset allocation portfolios (some portfolios hold both), also shows a strong trend. This company has a strong balance sheet and high regulated income.
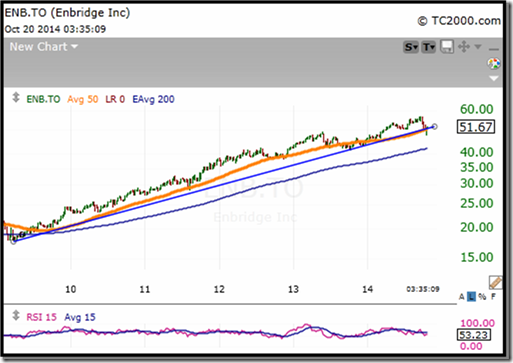
Enbridge Inc.
Enbridge has been a core holding in our asset allocation portfolio (the FOCUS portfolio) for a few years but the recent action in energy has caught our attention. We sold the pure energy names in late June and early July but maintained our pipelines and infrastructure names as they are less susceptible to the price of the underlying commodity as they profit from the commodity flow-through rate. The weakness in Enbridge is now suggesting that the move down in energy IS about end demand and that such names will have to reduce their pricing to adjust. We still own ENB. For now.
CastleMoore Inc. uses a proprietary Risk/Reward Matrix that places clients with minimum portfolios of $500,000 within one of 12 discretionary portfolios based on risk tolerance, investment objectives, income, net worth and investing experience. For more information on our methodology please contact us.
Buy, Hold…and Know When to Sell
This commentary is not to be considered as offering investment advice on any particular security or market. Please consult a professional or if you invest on your own do your homework and get a good plan, before risking any of your hard earned money. The information provided in CastleMoore Investment Commentary or News, a publication for clients and friends of CastleMoore Inc., is intended to provide a broad look at investing wisdom, and in particular, investment methodologies or techniques. We avoid recommending specific securities due to the inherent risk any one security poses to ones’ overall investment success. Our advice to our clients is based on their risk tolerance, investment objectives, previous market experience, net worth and current income. Please contact CastleMoore Inc. if you require further clarification on this disclaimer.
Disclaimer: Comments, charts and opinions offered in this report by www.timingthemarket.ca and www.equityclock.com are for information only. They should not be considered as advice to purchase or to sell mentioned securities. Data offered in this report is believed to be accurate, but is not guaranteed. Don and Jon Vialoux are Research Analysts with Horizons ETFs Management (Canada) Inc. All of the views expressed herein are the personal views of the authors and are not necessarily the views of Horizons ETFs Management (Canada) Inc., although any of the recommendations found herein may be reflected in positions or transactions in the various client portfolios managed by Horizons ETFs Management (Canada) Inc.
Individual equities mentioned in StockTwits are not held personally or in HAC.
Horizons Seasonal Rotation ETF HAC October 20th 2014
Copyright © Don Vialoux, EquityClock.com


