by Ryan Lewenza, Vice-President, CMT, CFA, North American Equity Strategist, TD Wealth
Below is the latest edition of The Technical Take, June 2, 2014. Highlights of today’s report include:
• The S&P/TSX Composite Index (S&P/TSX) continues to trade in a bullish upward channel, with the index consistently making higher highs and higher lows since its July 2013 low. Additionally, the index continues to find technical support at its rising 50-day moving average (MA). We view the 14,400 to 14,500 range as a key short-term technical support level. We maintain our bullish short-term stance on the S&P/TSX, as long as the index remains above this important support zone. A break below this range would likely cause us to revisit our bullish stance.
• The Canadian financials sector has traded in line with the broader market since February 2014, but we believe the sector could soon begin to outperform again. Given the strong performance in the energy sector year-to-date (YTD), and lagged performance by financials over this time, we believe there is the potential for some sector rotation into the financials, which if correct, could result in the financials breaking out on a relative basis.
• The S&P 500 Index (S&P 500) has made another all-time high, breaking above the psychologically important (but not technically important) 1,900 level. While calls for a market correction are picking up, the S&P 500 is showing little signs of technical weakness.
The index remains in an uptrend, is trading above its rising 50- and 200-day MAs, and continues to climb the proverbial "wall of worry."
• Copper has had an impressive short-term rally, moving up 8.5% since its recent lows. Despite the strong move, copper remains in a well-defined downtrend, and is trading below its 200-day MA. With copper approaching resistance around the US$3.20/lb. level, we would expect the upside to be capped in the short term.
• In this week’s report, we highlight Mondelez International Inc. (MDLZ-Q), Nordstrom Inc. (JWN-N), and Enerplus Corp. (ERF-T) as attractive technical buy candidates.
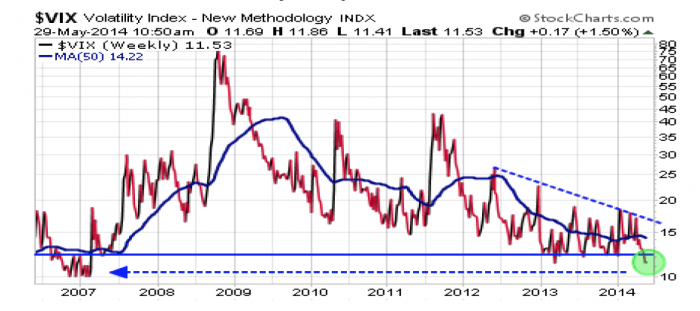
Chart of the Week: The Volatility (VIX) Index is trading at 2007 levels. Are investors overly complacent?


