November Sentiment Summary
Equities
- AAII survey readings came in at 45% bulls and 21.5% bears. Bullish readings have been quite elevated recently while bearish readings fell to extremely lows of just 17% last week. The AAII bull ratio has once again risen near the bullish extremes and over the last two weeks remains above 1.5 standard deviation mean. For referencing, AAII bull ratio survey chart can been seen by clicking here, while last months AAII Cash Allocation survey chart can be seen by clicking clicking here.
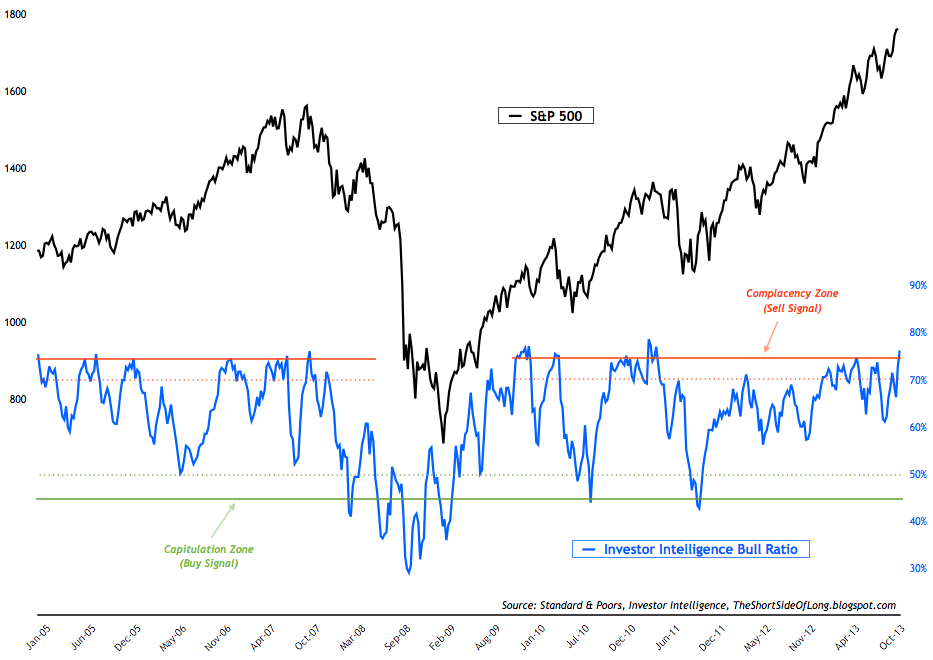
Chart 1: Most bullish newsletter sentiment since 2011 market top
Source: Short Side of Long
- Investor Intelligence survey levels came in at 53% bulls and 17% bears. Bullish readings has been rising sharply in the last couple of weeks, while bearish readings have now dropped to the lowest levels sicne the market top in 2011. The chart above shows the II bull ratio at extreme levels giving us a strong sell signal.
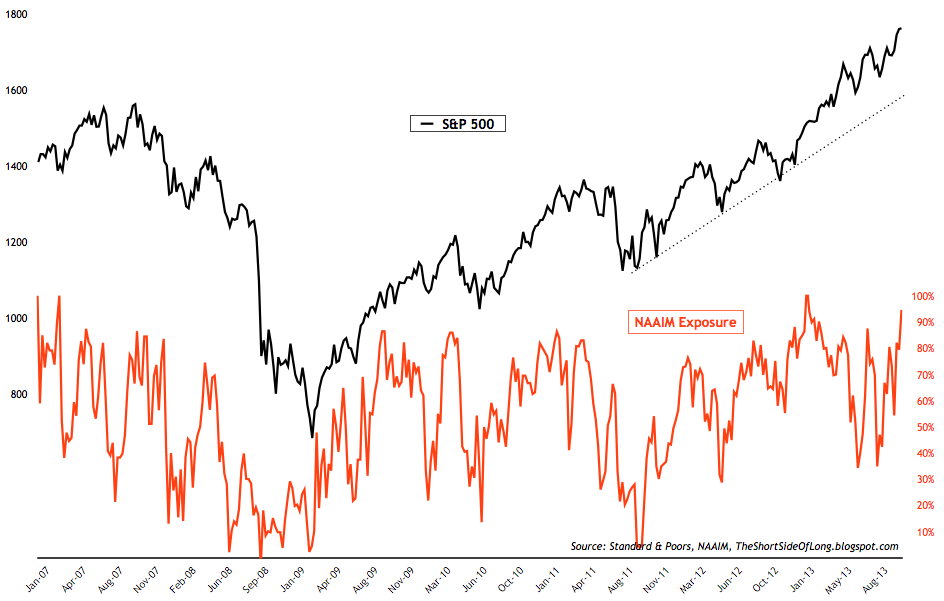
Chart 2: Managers are holding extreme net long exposure towards stocks
Source: Short Side of Long
- NAAIM survey levels came in at 95% net long exposure, while the intensity was at 145%. Fund managers currently hold one of the highest ever net long positions in the history of the survey and yet another clear sell signal.
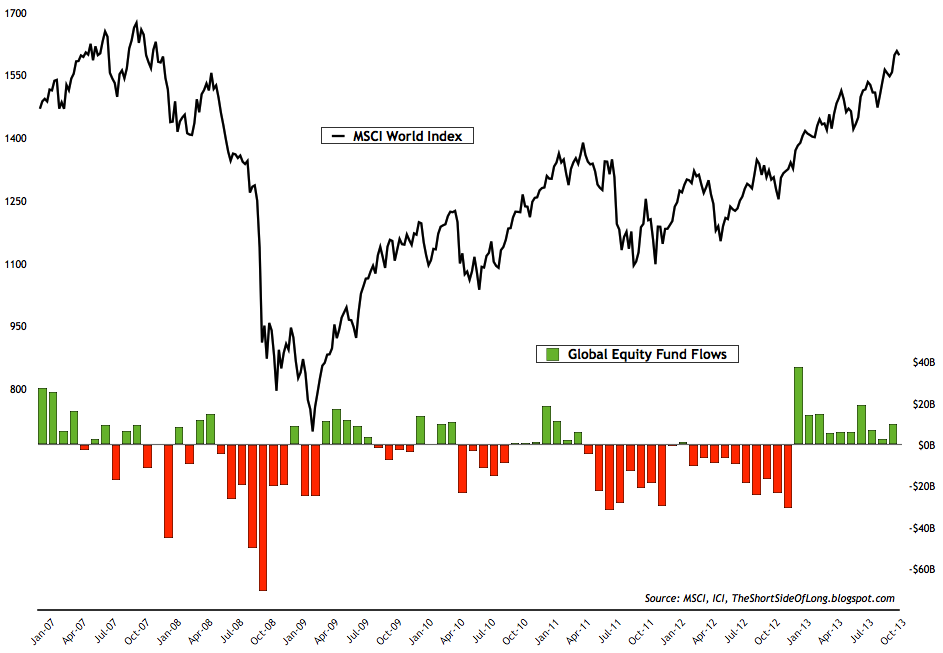
Chart 3: Stocks are experiencing a 10th consecutive monthly inflow
Source: Short Side of Long
- Recent ICI fund flows reports showed that "equity funds had estimated inflows of $13.54 billion for the week, compared to estimated inflows of $2.93 billion in the previous week. Domestic equity funds had estimated inflows of $9.19 billion, while estimated inflows to world equity funds were $4.36 billion." Capital is leaving bond funds at a rapid pace, as equity inflows continue. According to Sentimentrader, Lipper fund flow data showed "investors have contributed a net $41 billion to equity mutual and exchange traded funds over the past three weeks. Going back to 2002, that exceeds the prior 3-week record inflow by more than 17%."
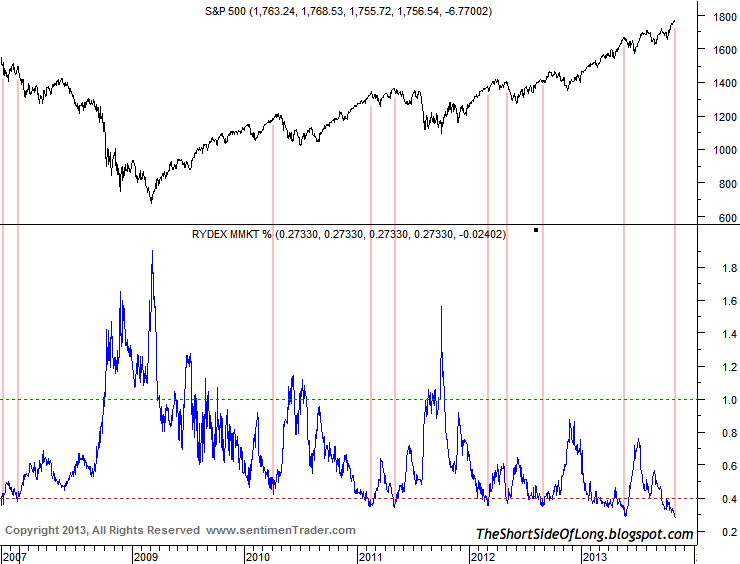
Chart 4: Retail investor cash levels are now at extreme lows
Source: SentimenTrade (edited by Short Side of Long)
- Rydex fund flows have risen in recent weeks. Nova Ursa flow of funds indicator remains just above 0.30, which is a neutral reading right now. However, what is more important is the fact that Rydex cash levels have fallen to extremely low levels (chart above). While the chart shows that a correction tends to occur when the readings drop below 0.4, this is now only the forth time since 2001, that the readings have dropped below 0.3. This indicates extremely low levels of cash, meaning that retail investors are fully loaded into the equity market.
Chart 5: Hedge funds remain heavily exposed towards tech equities
Source: Short Side of Long
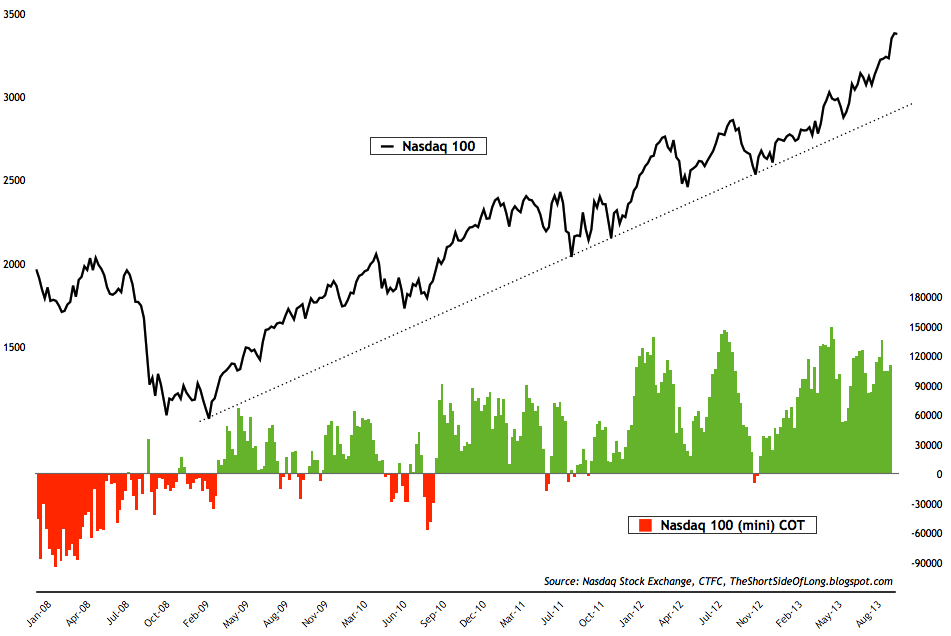
- Recent commitment of traders reports showed that hedge funds and other speculators remain heavily exposed towards technology stocks via the Nasdaq index. Due to the US government shutdown, the data is still delayed by one week, however recent positioning still remains above 120,000 net long contracts on a 4 week moving average basis. That is one of the most extreme exposures since the March 2009 bull market began.
Chart 6: Hedge funds remain heavily exposed towards tech equities
Source: Insider Insights
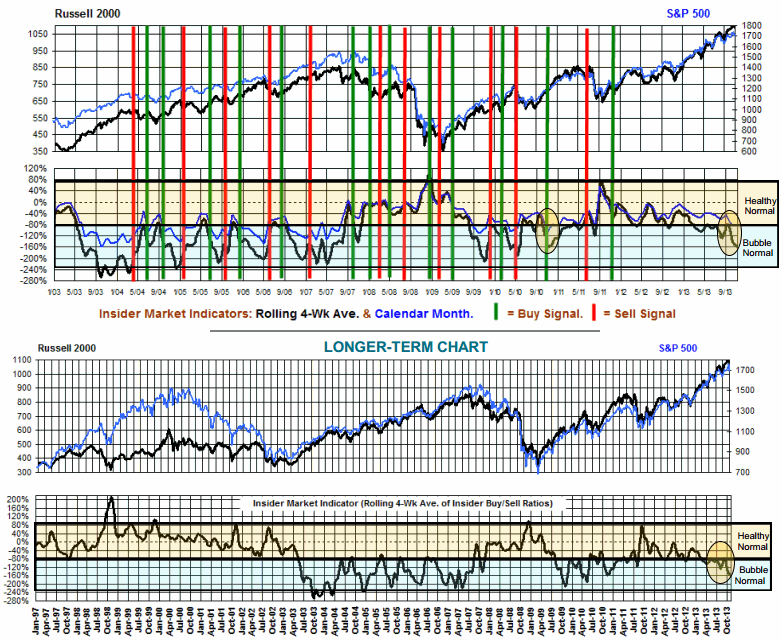
- Corporate insiders have turned net sellers of stocks in recent weeks. Recent report from Insider Insights states that while "selling into strength is normal for insiders, the absolute level of our Indicator is finally making us concerned for the first time since our longstanding green vertical “Buy” signal was generated in the fall of 2011." The chart above shows that this is the first time corporate insiders are selling heavily since the October 2011 low.
Chart 7: In the options market, Skew Index is warning of a potential sell off
Source: BarChart (edited by Short Side of Long)
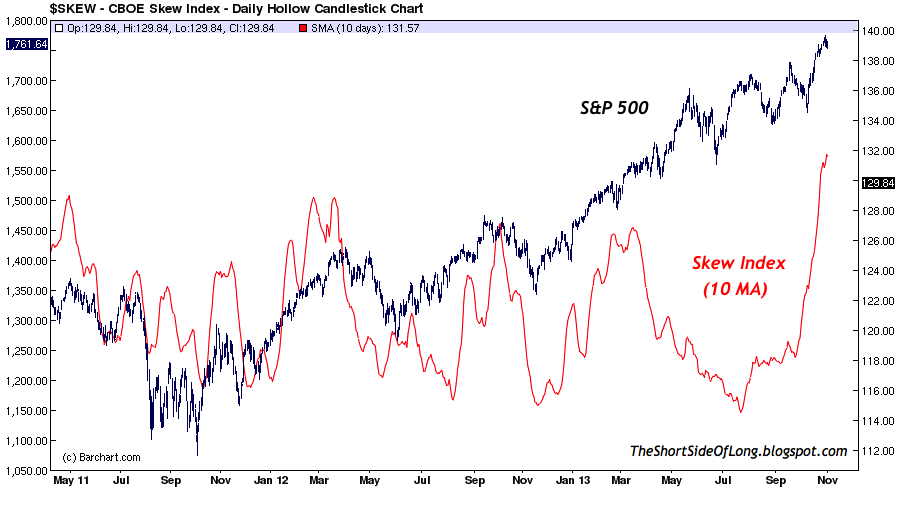
- Within the options market, the volatility index (VIX) has fallen to extreme lows (current reading is at 13). On the CBOE exchange, purchases of Total as well as Equity Only options has been elevated when averaged over 5 and 10 days. Finally, the 10 day average of the Skew Index has risen to one of the highest levels in years. For those not familiar with the indictor, the Skew Index measures the risk of a "black swan" crash event in the S&P 500 through option pricing. The higher the reading, the biggest the stock market risk.
Bonds
Chart 8: Advisors remain extremely bearish on Treasury bonds
Source: SentimenTrader
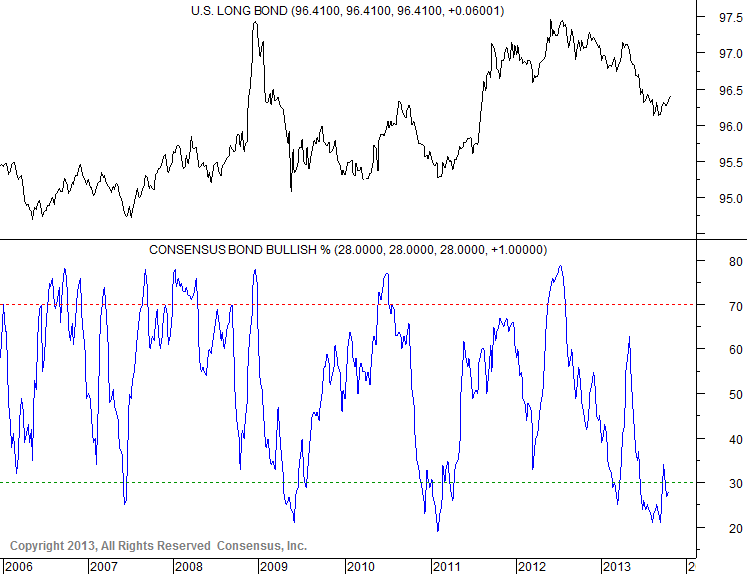
- Bond sentiment surveys remain at very pessimistic levels, similar to last month. In particular, Consensus Inc survey shown in the chart above still remains at one of the more extreme levels since February 2011. Basically, this is a buy signal, and so far bonds have responded well by rising above the recent lows in early September.
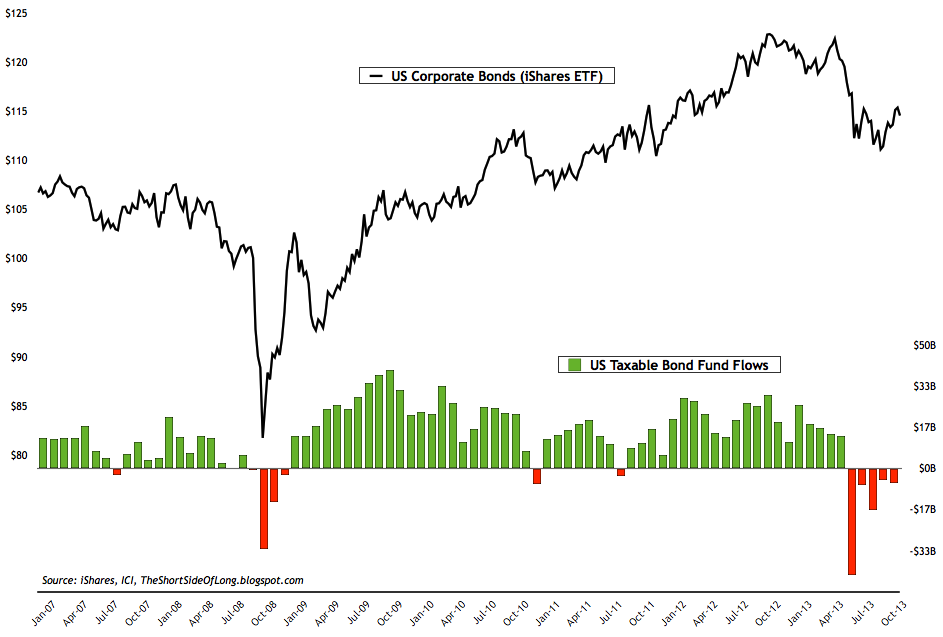
Chart 9: Capital continues to leave bond funds for the fifth month in the row!
Source: Short Side of Long
- Recent ICI fund flows reports showed that "bond funds had estimated outflows of $2.32 billion, compared to estimated outflows of $5.45 billion during the previous week. Taxable bond funds saw estimated outflows of $1.30 billion, while municipal bond funds had estimated outflows of $1.02 billion." This is now the fifth consecutive monthly outflow out of all major taxable bond funds. From a contrarian point of view, retail investor selling has almost always given us a good buy signal, at least for a short term trade.
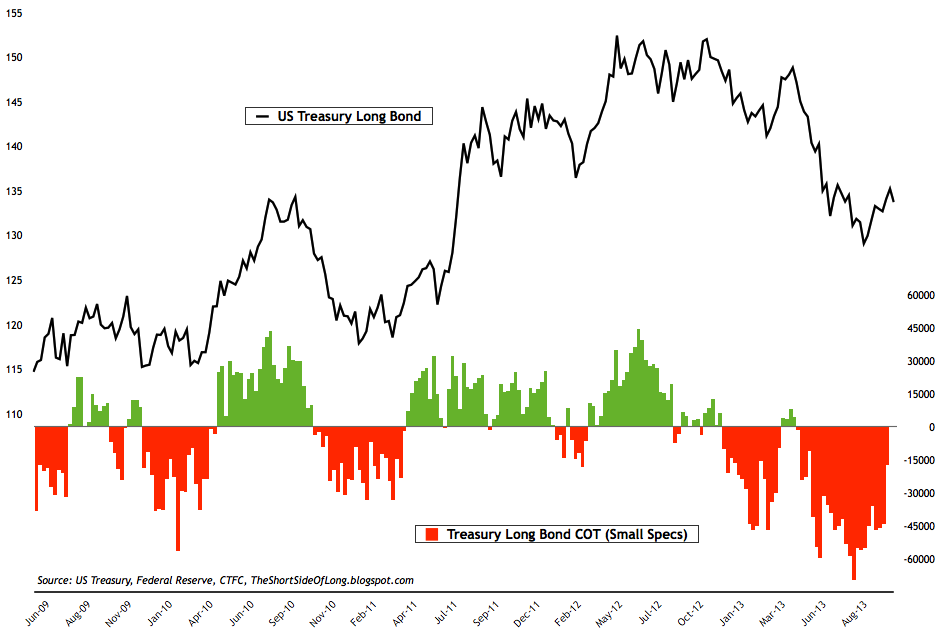
Chart 10: Super bearish Treasury bond exposure remains in place
Source: Short Side of Long
- Recent commitment of traders report shows that small speculators have started covering their Treasury bond short exposure in expectation of higher prices. Current readings now stand close to -17,000 net short contracts relative to -70,000 net short contracts a couple of months ago, which was one of the most negative positions in years. It seems that the short squeeze is finally in progress.
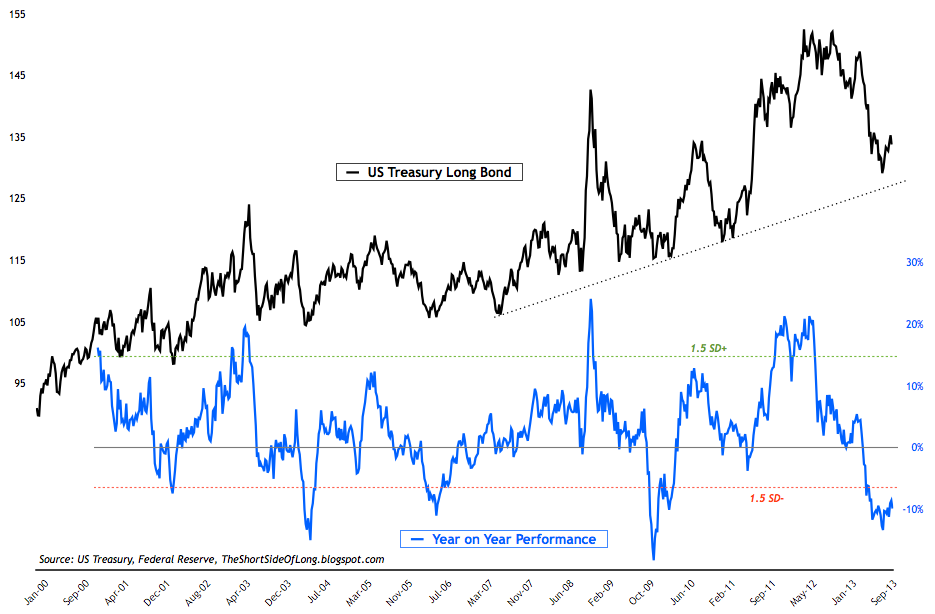
Chart 11: Historically Treasury bonds remain extremely oversold
Source: Short Side of Long
- Side Note: With the equity market overbought and sentiment extremely bullish, the question is weather shifting capital towards bonds would be a better idea for the time being? There is definitely merit in holding this view and despite the fact that the short covering rally is currently in progress from the September lows, bonds might rally a bit more. The chart above shows that at present, Treasuries are extremely oversold on historic basis. A revision to mean is to be expected.
Commodities
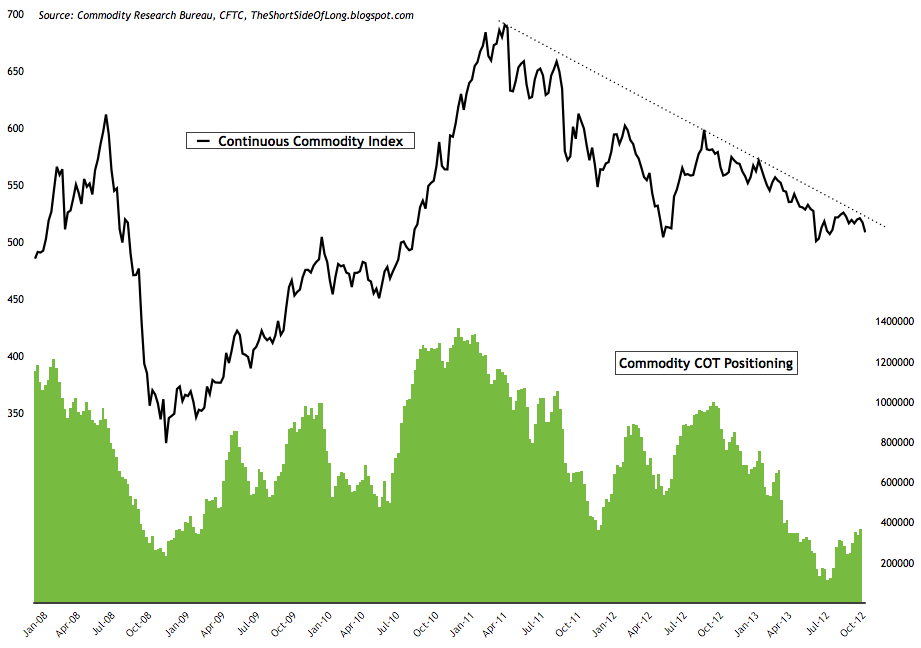
Chart 12: Commodity exposure has risen slightly in recent weeks
Source: Short Side of Long
- Recent commitment of traders report showed that hedge funds and other speculators increased their commodity exposure, but only ever so marginally. Cumulative net longs currently stand close to 400,000 contracts (custom COT aggregate), which is modest increase from the the very low levels of 115,000 in early August. Price wise, the overall sector still remains in a downtrend, as seen in the chart above.
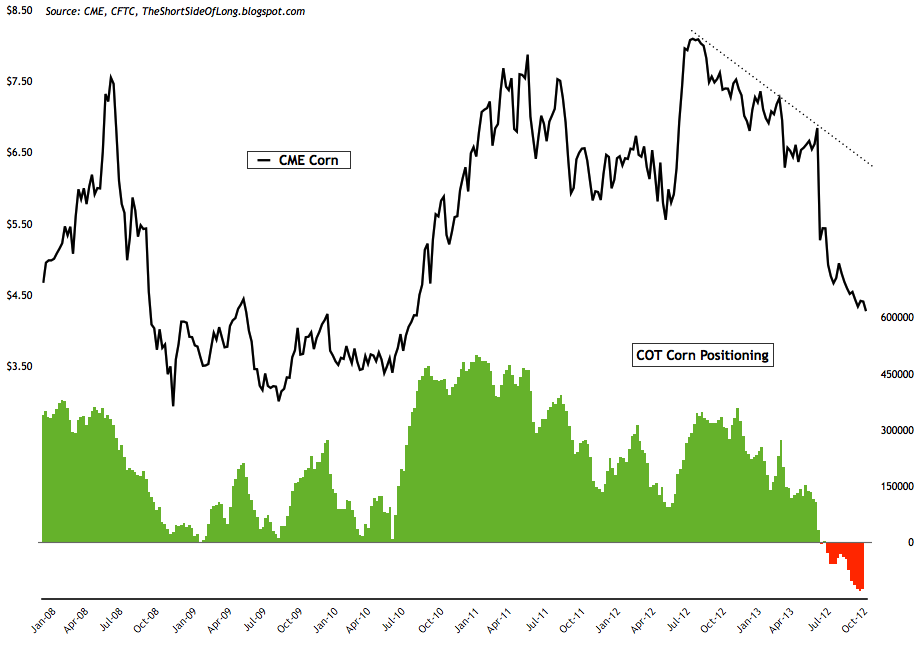
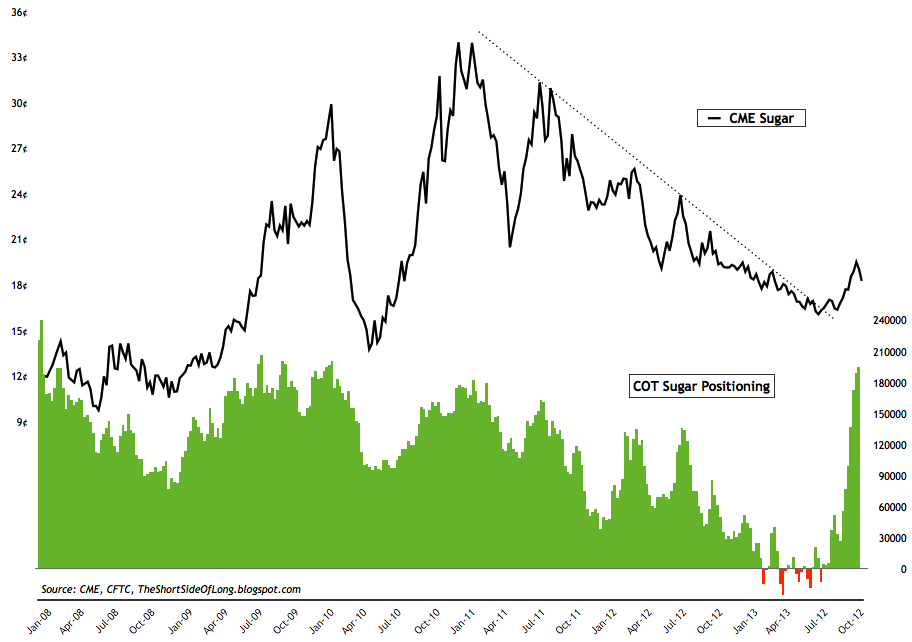
Chart 13 & 14: Agricultural exposure is mixed, with positioning extremely bearish on Corn and extremely bullish on Sugar
Source: Short Side of Long
- Individual commodity exposure remains mixed. One of the better ways of showing this is by analysing the agricultural sector. The two charts above shows how hedge funds and other speculators hold huge net short positions on Corn, while at the same time we see a massive build up in net long Sugar positions. Other commodities show a mixed picture too. Crude Oil position is still rather elevated, while Heating Oil is showing net shorts building fast. Hedge funds were negative on industrial metals like Copper in July of this year, but a short squeeze has moved those positions back to slight net longs. Finally, speculators continue to short Coffee, while positioning in Wheat and Soybeans is at neutral levels.
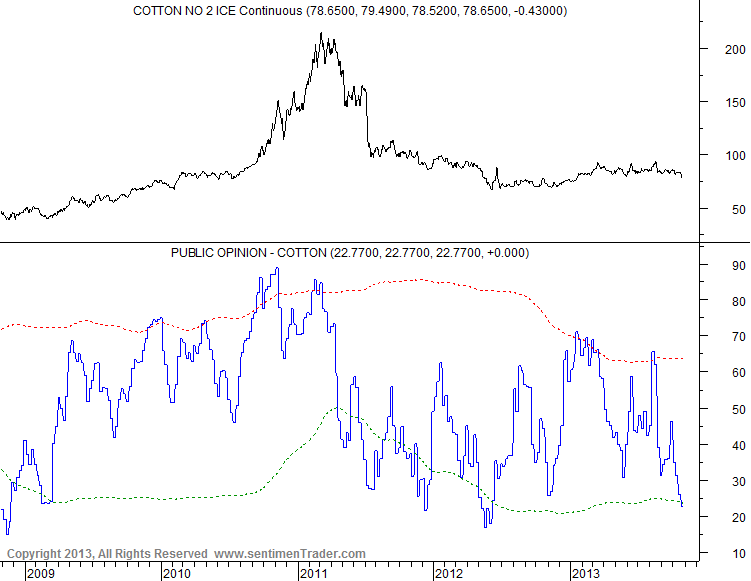
Chart 15: Investor sentiment has turned very sour on Cotton prices
Source: SentimenTrader
Currencies
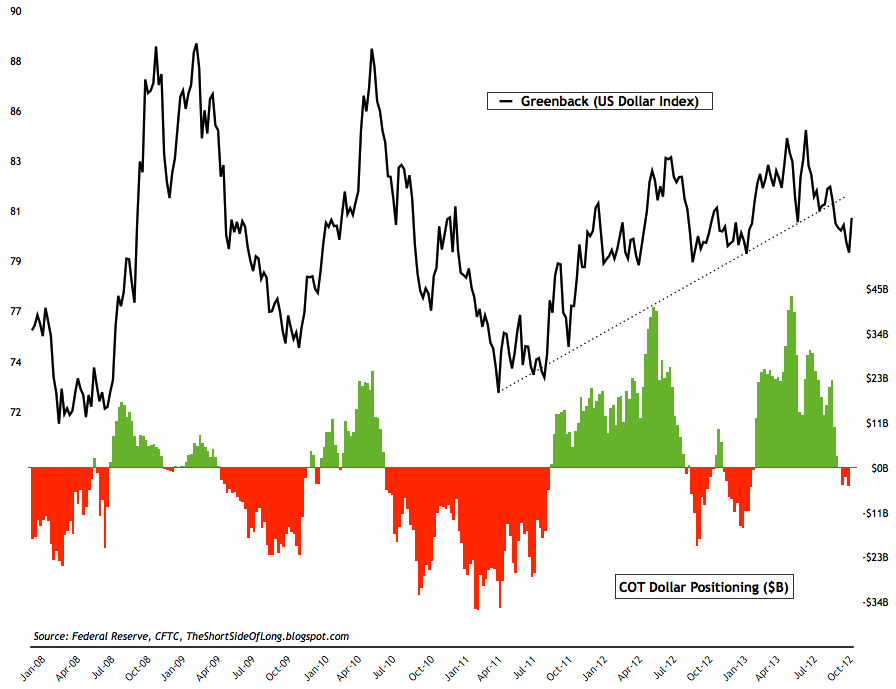
Chart 16: Hedge funds have switched to net short greenback exposure
Source: Short Side of Long
- Recent commitment of traders reports showed a continued decreased towards the US Dollar. Cumulative positioning by hedge funds and other speculators has now fallen towards a slight net short position, which is a far cry from over $40 billion net long. Major net long positions are evident in the Euro, while major net shorts on the Aussie and the Yen. Technically, the greenback is still testing its uptrend line at this point in May of this year.
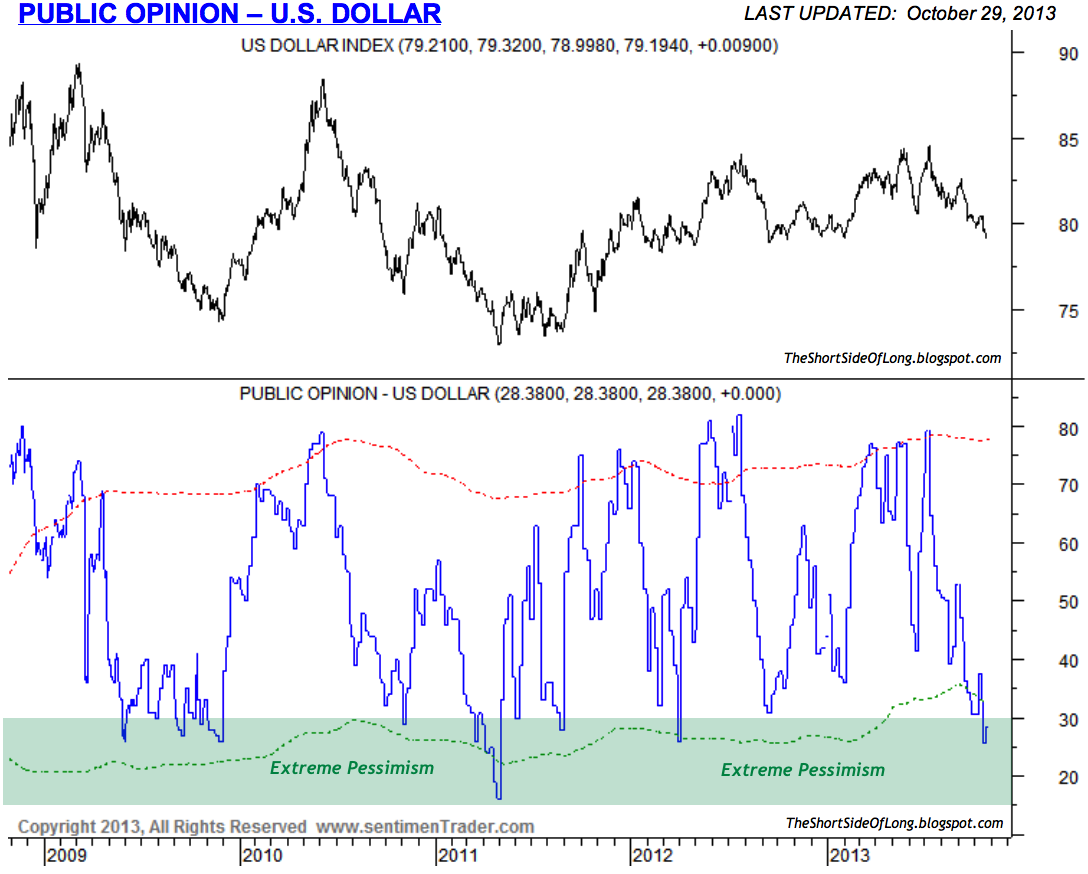
Chart 17: Investor sentiment on the US Dollar is currently very negative
Source: SentimenTrader (edited by Short Side of Long)
- Currency Public Opinion survey readings on the US Dollar confirm the COT report, by showing extreme pessimism only reached a handful of times over the last half a decade. At the same time, Public Opinion on the foreign currencies is also rather elevated, with investors favouring currencies like the Euro and the Pound by a wide margin.
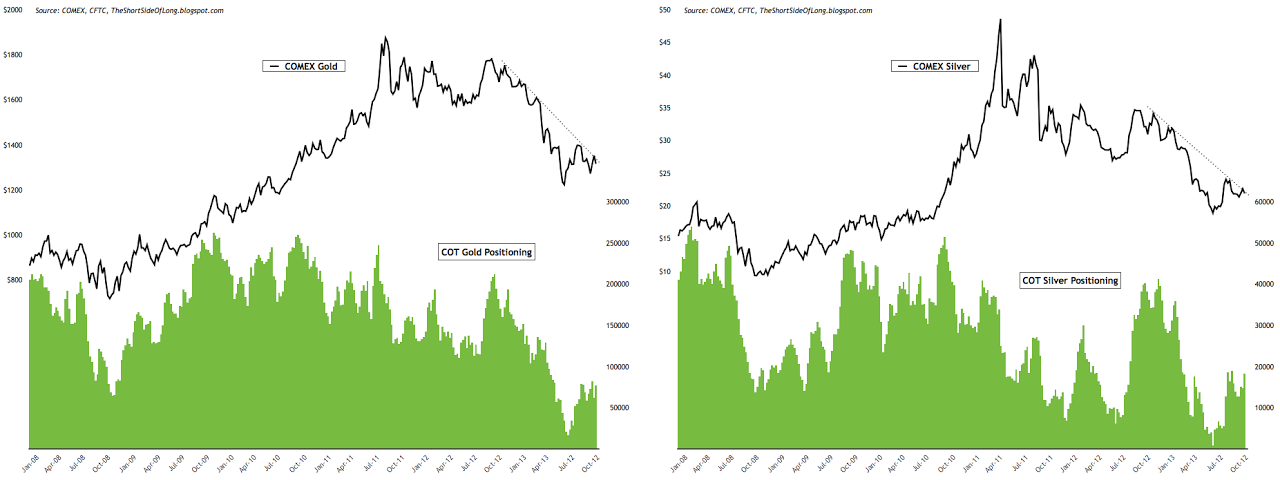
Chart 18: Speculators have increased their precious metals exposure
Source: Short Side of Long
- Recent commitment of traders reports showed hedge funds and other speculators remain somewhat unmoved on the overall Precious Metals sector. Positioning currently stands at 76,600 net long contracts on Gold and 18,200 net long contracts on Silver (let us not forget that the data is delayed by a whole week due to the US government shutdown). The chart above shows that speculators have been adding exposure towards metals for a few weeks now. Public opinion on alternative currencies like Gold and Silver is now around neutral levels from the depressed levels witnessed during the summer doldrums, as prices found a trough.
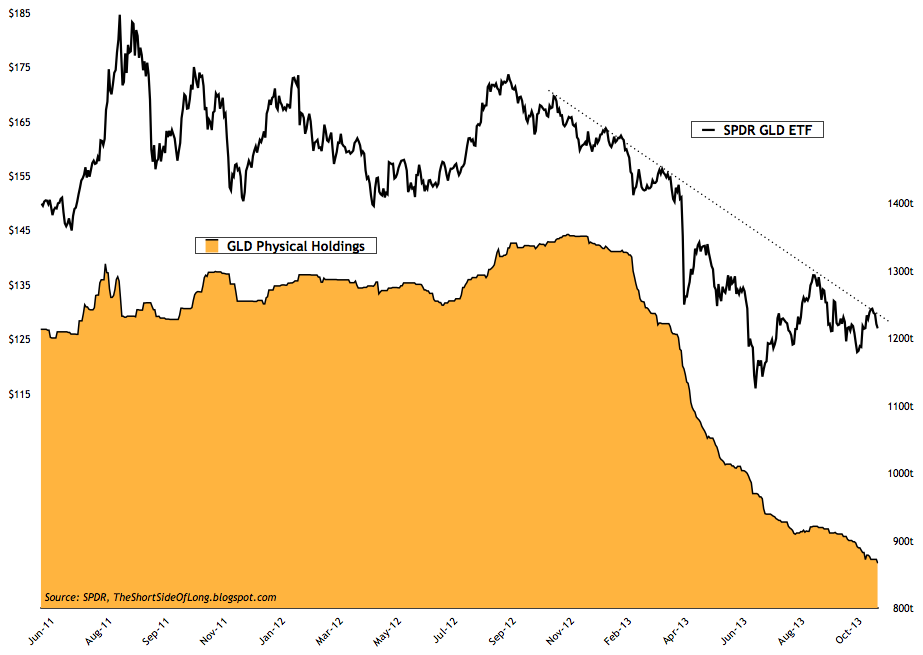
Chart 19: Investors continue to sell off physical Gold out of GLD ETF
Source: Short Side of Long
- However, other indicators still point towards continued weakness. One of those is the GLD ETF holdings of physical gold. As we see in the chart above, investor behaviour has not yet changed from selling towards buying, as physical gold continues to leave the electronic traded fund. We are now approaching a level of 875 tonnes, which is 135, which is about 35% lower then the peak in November 2012.


