by Charts Etc.
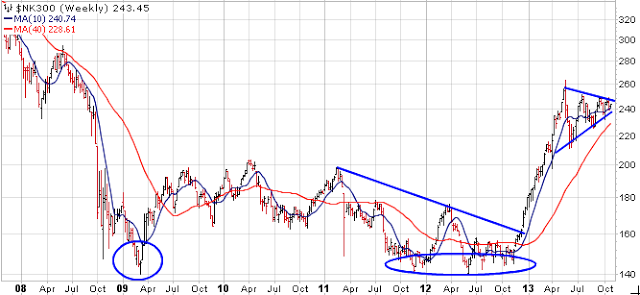
The Nikkei is setting up to resume its rise. The weekly chart below says it all:
Source: Stockcharts.com
After completing a double-bottom spanning four years, the Index broke out late last year, shooting up by 60+% in six months, and has since been carving out a classic pennant formation. Flags and pennants are continuation patterns, meaning they typically occur within a trend and resolve with the trend continuing -- in this case, the trend being up. Also, flags and pennants have high hit or success rates, i.e. odds greatly favor a continuation of the preexisting trend versus a reversal. That said I would expect the Nikkei to eventually break out and resume its ascent.
Some may question the rise in the Nikkei earlier this year wondering if it appeared to be parabolic and therefore climatic, with the pennant formation instead setting up for a fall. Leaving aside the aforementioned point that flags/pennants tend to be continuation patterns with high success rates, parabolic "blowoff" or climatic peaks typically occur after extended moves, occurring over many months or years. Think of late 1999, early 2000 for the U.S. stock market. To me this move in the Nikkei is still early.
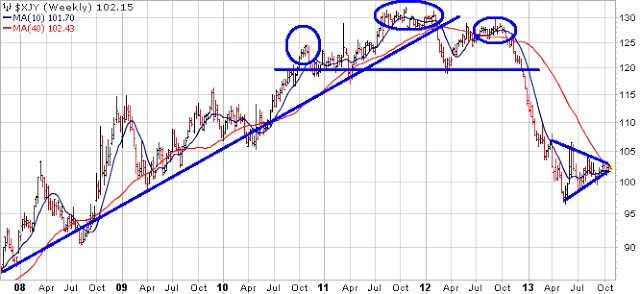
Finally, the chart of the Yen is quite revealing:
Not surprisingly, a near-opposite picture of the Nikkei, with a pennant formation recently occurring within a downtrend -- next move should be down. Note the Yen is up against its 200-day moving average (red line), now resistance. Also, from 2010-2012, the Yen completed a massive bearish head-and-shoulders formation, breaching the neckline late last year.
With respect to these charts, clearly Japanese QE appears to be working.
Copyright © Charts Etc.


