“The Magic of Compound Interest”
by Jeffrey Saut, Chief Investment Strategist, Raymond James
August 20, 2012
There was a king who held a chess tournament among the peasants and asked the winner what he wanted as his prize. The peasant, in apparent humility, asked only that a single kernel of wheat be placed for him on the first square of his chessboard, two kernels on the second, four on the third – and so forth. The king fell for it and had to import grain from Argentina for the next 700 years. Eighteen and a half million trillion kernels, or enough, if each kernel is a quarter-inch long (which it may not be; I’ve never seen wheat in its pre-english-muffin form), to stretch to the sun and back 391,320 times. That was nothing more than one kernel’s compounding at 100 percent per square for 64 squares.
... “Money Angels” by Andrew Tobias
When compound interest works in your favor, it is a blessing. But when it works against you, it is a curse. Just ask Washington Mutual, or General Motors. More recently ask Greece, whose “debt chickens” have come home to roost. For example, Greece’s 10-year sovereign note sported a yield of around 5% back in 2010. Subsequently, it soared to more than 30% earlier this year, and currently changes hands around 24%. When yields are double-digits the power of compound interest working against the borrower is awesome. Consider the following example from the same book by Andrew Tobias illustrating the term of interest and return on interest:
Say you borrowed $1,000 from a friend and paid it back at the rate of $100 a month for a year. What rate of interest would that be? A lot of bright people will answer 20 percent. After all, you borrowed $1,000 and paid back $1,200, so what else could it be? Forty percent? No [it’s] more. If you’d had use of the full $1,000 for a year, then $200 would, indeed, have constituted 20 percent interest. But you had full use of it for only the first month, at the end of which you began paying it back. By the end of the tenth month, far from having use of $1,000, you no longer had use of ANY of the money. So you were paying $200 in the last two months of the year for the right to have used an average of $550 for each of the first ten [months]. That comes to a bit more than a 41.25 percent effective rate of interest. (Trust me).
I revisit this compound interest theme this morning because the recent rise in interest rates has been one of the most important events that have occurred over the past few weeks. The rate rise is important because this week the U.S. Debt Clock will cross above $16 trillion (excluding off balance sheet items), and if we stay on the same debt course by 2015 the U.S. will have accumulated $20 trillion in debt. Accordingly, the increase in the 10-year T’note’s yield, from 1.38% on July 24th to last week’s high of 1.86%, is significant. Consider this, by 2015, if our debt is at $20 trillion, an aggregate yield on that debt of 2.5% means the cost of servicing the debt is roughly $500 billion per year. At a yield of 5% our debt service cost would be $1 trillion; and at 10%, the yearly debt service would be $2 trillion, or nearly all of the $2.3 trillion our government receives in revenues! Unsurprisingly, most of the folks I talk to inside the D.C. Beltway realize we are on an unsustainable path; and that’s why I think no matter who is elected in November my sense is we are going to get smarter policy makers, more practical policy, and more productivity out of government. Currently few believe this is possible, but if you look at what’s happening at the grassroots level there are a lot of good things happening on both the “left” and the “right.” One entity that appears to embrace this more positive scenario is Mr. Market.
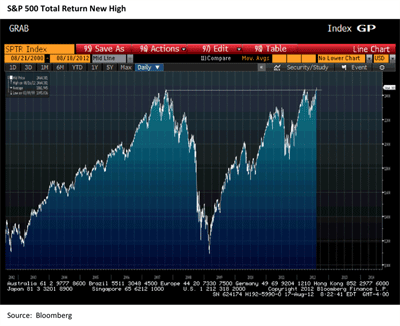
Indeed, while there are some pundits commenting on the recent increase in interest rates, there is NOBODY expounding on the fact that the S&P 500 Total Return Index is probing new all-time highs (see chart on page 3). To be sure, I am aware of all the bearish arguments swirling down the canyons of Wall Street, but the bears continue to misunderstand there is not a linear relationship between the fundamentals and the movement of the markets. Manifestly, it takes a massive deflationary shock, like what we experienced in 2008, to cause a waterfall decline in stock prices; and, I just don’t see that on the horizon. Actually, I think the rise in interest rates is more about the improving economic backdrop and the inflation that should accompany it. As the invaluable Bank Credit Analyst organization wrote back in 2007:
The history of the U.S. is characterized by a long-run increase in indebtedness, punctuated by occasional financial crises and subsequent policy reflation. The sub-prime blow-up is the latest installment in this ongoing Debt Supercycle story. During each crisis, there are always fears that conventional reflation will no longer work, implying the economy and markets face a catastrophic debt unwinding. Such fears have always proved unfounded, and the current episode is no exception. A combination of Fed rate cuts, fiscal easing, and a lower dollar will eventually trigger another upleg in the Debt Supercycle, and a new round of leverage and financial excesses. The objects of speculation are likely to be global, particularly emerging markets and resource related assets. The Supercycle will end if foreign investors ever turn their back on U.S. assets, triggering capital flight out of the dollar and robbing U.S. authorities of any room to maneuver. This will not happen any time soon.
“Not any time soon,” says the Bank Credit Analyst and I agree, which is why my mantra has been, “You can get cautious, but do not get bearish!” Importantly, I have likened the March 2009 “low” to the nominal price low of December 1974, which was the “print low” of the 1966 – 1982 wide-swinging, trading range stock market. Further, I have suggested the October 4, 2011 “undercut low” might be the equivalent of the “valuation low” of August 1982 before the 1982 – 2000 secular bull market began. Whether we are now into a new secular bull market is questionable, but secular “bull” markets typically arise when valuations are parsimonious, the economy is a mess, politics are leaning to the left, and individual investors have abandoned stocks. If that sounds familiar, it should for that is precisely the environment we have had for awhile.
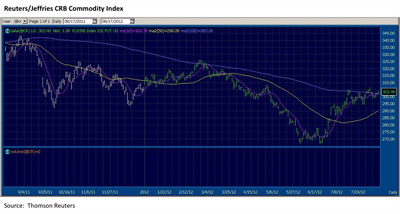
Over the longer-term I will let Mr. Market tell us if we are in a secular bull market. As for the here and now, I have been treating the June 4th low as THE daily/intermediate-term cycle low. More recently, I opined that while the S&P 500 (SPX/1418.16) may pause, or pull back, around the 1400 level, but that any pullback should be shallow with the real bull/bear battle coming at the April highs of 1420 – 1422. And, that is where we were late last week. Typically the initial assault on a key resistance level like 1420 fails. It tends to take two or three attempts before a key level is surmounted. For example, the Reuters/Jeffries CRB Commodity Index (@CR/303.48) made a reaction high on May 1, 2012 at 307.95. Subsequently, it has tried to better that high on July 19th, August 9th, and is currently trying for the third time to close above its May 1st high (see chart on page 3). My sense is this time it makes it because triple tops rarely hold. That view is reinforced by the recent sell-off in the Dollar Index (@DX/82.54), which closed below its 50-day moving average on Friday. If the U.S. dollar keeps falling it should put the wind at the back of the CRB, as well as gold, which is also trying to break out above a triple top around $1630.
The call for this week: The S&P 500 Total Return Index (&SPXT/2469.00) is trying to break out to new all-time highs, as can be seen in the chart on the next page. It may also be pointing the way for the S&P 500 because if the SPX can decisively break out above its April highs of 1420 – 1422 it potentially brings into view targets above 1500. And while it is doubtful the SPX can breakout above those “highs” on its first try, I think it will indeed eventually break out. Of course, the grind higher from the June 4th low has been accompanied by total disbelief among individual and professional investors. That is reflected not only in the flow of funds by individual investors out of equity-centric mutual funds, but in the latest Commitment of Traders report that shows the “pros” have been caught heavily on the short side into a rising equity market. So the fuse is burning and I think it is just a matter of time until the SPX travels above 1422.
Click here to enlarge
Click here to enlarge
Copyright © Raymond James


