by Jurrien Timmer, Director of Global Macro for Fidelity Management & Research Company (FMRCO),
Markets seem to think rate cuts are imminent. But that may be wishful thinking.
Key takeaways
- While the Fed hasn’t committed itself to a pause in rate hikes, there is a broad expectation in markets that this rate-hike cycle is now over.
- But what comes next is less clear. Markets seem to expect the Fed will start cutting rates soon, but the Fed has signaled it may keep rates high for some time.
- First quarter earnings season has been quite strong, which supports the notion that we could see a soft landing for the economy.
- That said, it’s still too soon to say we’re in a new bull market—in part because the market isn’t behaving the way new bull markets usually do.
The Fed raised rates as expected last week, and the broad consensus among investors and in the markets is that it was the last rate hike for this cycle. (The Fed itself didn’t commit to an end to rate hikes, but it did signal that pausing here is a very real possibility.)
While last week’s hike was broadly expected by markets—just as an end to the hikes at this point is broadly expected—what comes next is more of an open question. According to expectations priced into markets (which, granted, in fact are often wrong), the Fed will start a campaign of cutting rates, as shown below in the blue line. Given how high inflation still is, and how resilient the economy still seems to be, I think that may be wishful thinking.
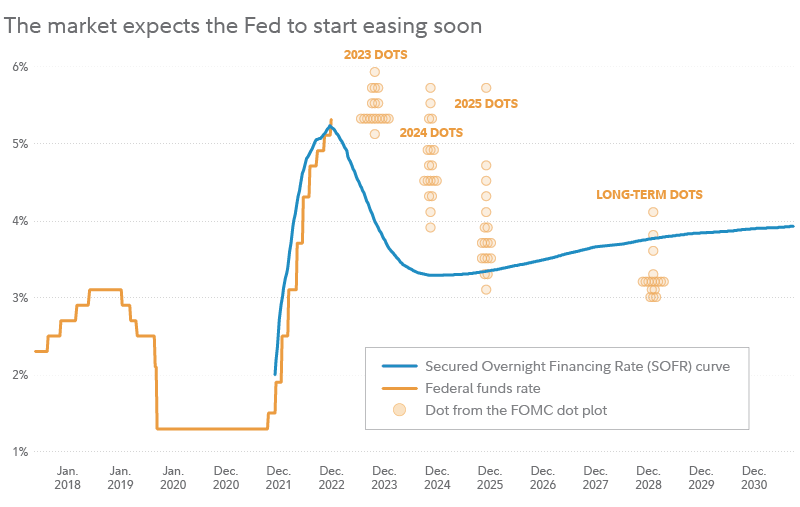 The Secured Overnight Financing Rate (SOFR) curve shows implied estimates for future interest rates that are embedded into current yield curves. Each dot represents an FOMC participant's assessment of appropriate monetary policy for a future period, based on the dot plot released March 22, 2023. Source: FMRCo., Bloomberg.
Why does the market expect the Fed to imminently drop rates back to 3% or below? Perhaps it’s flawed modeling by bond traders. Or perhaps they are just using the average of all cycles. Historically, the Fed more often than not starts easing soon after its final rate hike. In fact, the forward interest-rate curve above looks almost identical to the average easing cycle that typically follows the peak of a rate-hike cycle.
How important is this disconnect? It may depend on where the economy, and inflation, go from here. If inflation continues to improve and the economy stays resilient, rates that are higher for longer could prove benign for markets. On the other hand, if inflation becomes stubborn and the economy weakens, then that disconnect could become significant.
Have rates gone high enough?
In very simple terms, the Fed’s new 5% to 5.25% target range for the fed funds rate is the highest it’s been since 2007. But with inflation still elevated, are rates restrictive enough?
Based on my own calculations of what would be a “neutral” fed funds rate (meaning one that is neither restrictive nor accommodative), the Fed is moderately restrictive—with the current fed funds rate about 1 percentage point above neutral.
Another way of looking at it is by comparing the policy rate to the inflation rate. The Fed’s current target rate is now also above the 4.6% annual rate of change in the core Personal Consumption Expenditures Price Index (which measures price inflation felt by consumers, excluding food and energy, which tend to be more volatile). So by that definition the Fed is also moderately restrictive.
But based on the chart below, since the 1970s the Fed has generally raised rates to above the peak in headline inflation. So depending on which exact inflation measure one uses, by that standard the Fed may still be accommodative.
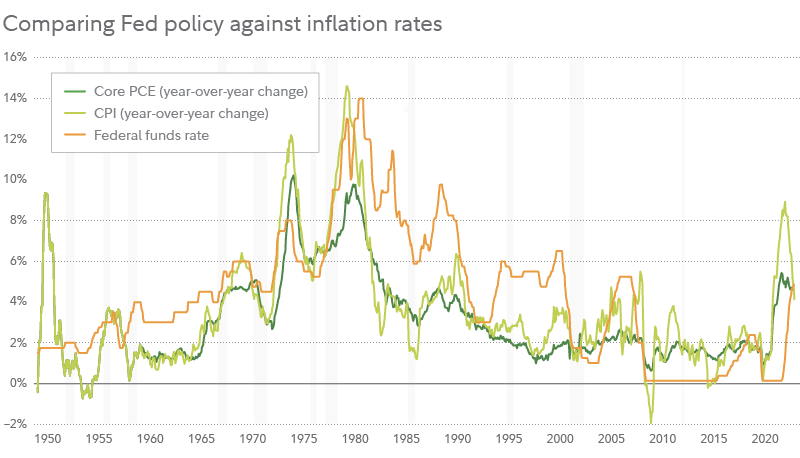 Core PCE is the Personal Consumption Expenditures Price Index excluding food and energy. CPI is the Consumer Price Index. Source: FMRCo., Bloomberg, Haver.
Time will presumably tell whether a 5% to 5.25% fed funds rate is restrictive enough.
Some signs of a soft landing
First-quarter earnings season is now heading toward the finish line, and the results have been strong. Out of the 425 companies that had reported by last week, 78% have beaten estimates—beating them by an average of 6.72 percentage points. It’s hard to see this earnings season as a glass half-empty.
The strength in earnings is supported by the fact that revenues continue to march to new highs (at least in nominal, or non-inflation-adjusted, terms).
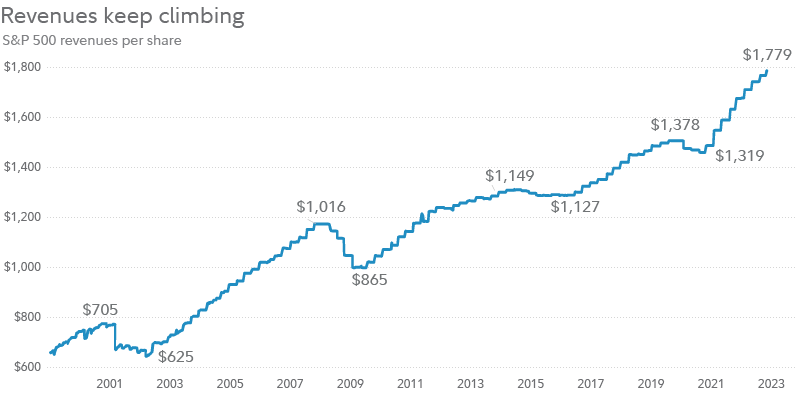 Source: Bloomberg, FMRCo.
And with revenues trending higher and earnings growth starting to flatten out, by definition it also means that profit margins are stabilizing.
Yet the market isn’t acting like a bull market
Consensus earnings estimates are suggesting that the US is headed for a soft landing. And this earnings season showed some encouraging signs.
But not all signs are pointing in the same direction. While the S&P® 500 is up more than 8% so far this year (and around double that since the market’s October low), there is uneven participation beneath the surface.
Early-cycle bull markets tend to be driven by segments and styles that are more economically sensitive and more volatile. Small- and microcap indexes are usually in or close to the lead in an early bull market—posting strong performance and usually beating larger-cap indexes like the S&P 500. But not this time.
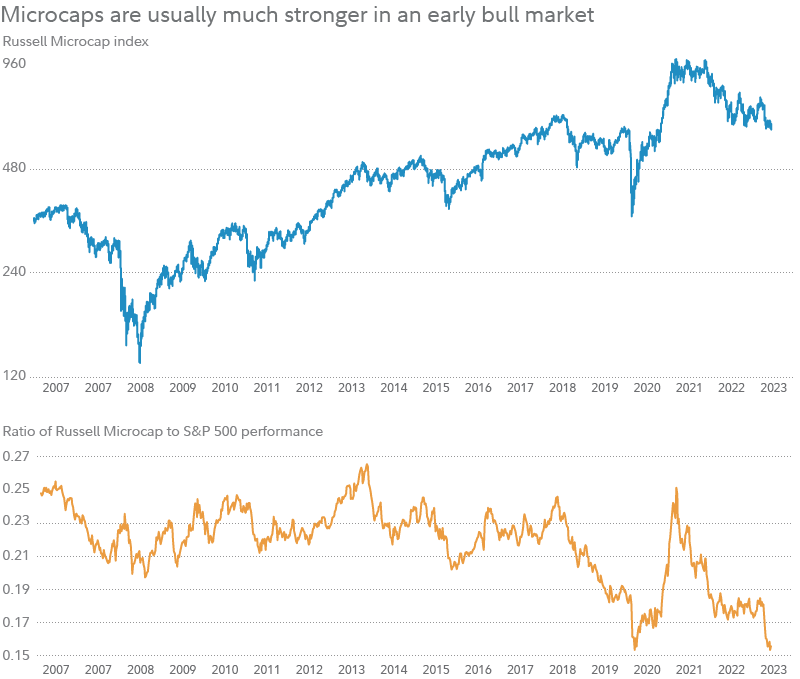 Relative performance of Russell Microcap index to S&P 500 is taken by dividing the level of the Russell Microcap index by the level of the S&P 500 index. Source: FMRCo., Bloomberg, Haver.
The weakness in small caps and microcaps is not consistent with the idea that an early-cycle bull market is sprouting, and continues to cast at least some doubt on where we go from here.
That—along with expectations for the Fed—is among the key inconsistencies facing this moment in the markets, and why this still doesn’t look like the start of a new bull market.


