by Don Vialoux, EquityClock.com
The Bottom Line
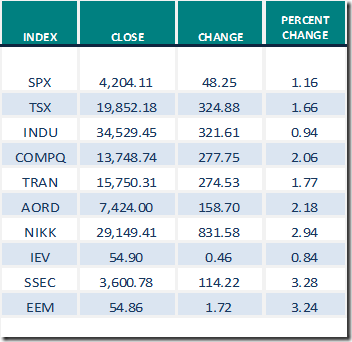
Most U.S. equity indices moved higher last week. Greatest influences on North American equity markets remain evidence of a third wave of the coronavirus and possibility of a fourth wave (negative) and continued expansion of distribution of a vaccine (positive).
Observations
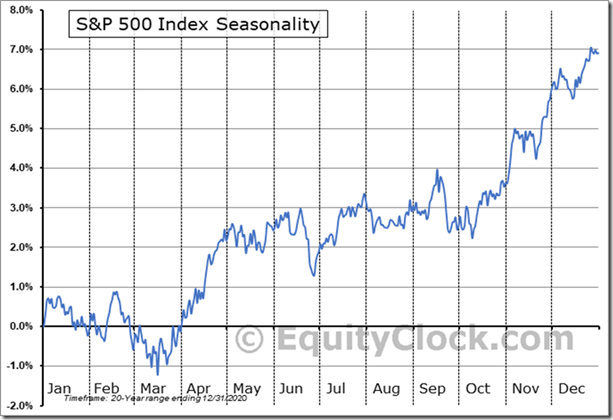
The S&P 500 Index is following its historic seasonal pattern for this time of year, a mixed, choppy period between early May and the second week in October. Average return during this period is close to zero. Positive returns are possible by selecting sector investments that outperform during the period.
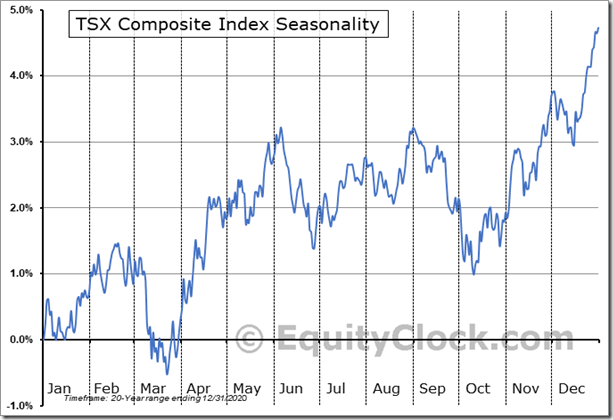
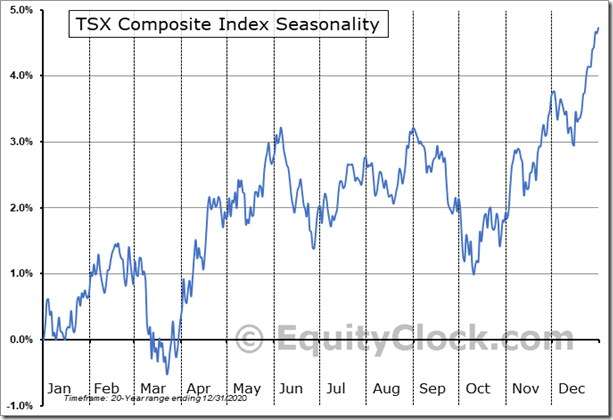
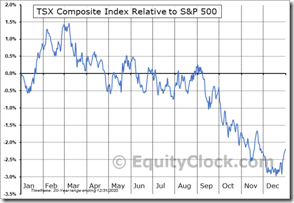
Last week, the TSX Composite Index continued to follow its historic pattern of outperforming the S&P 500 Index on a real and relative basis until early June. Note that seasonal influences on a real and relative basis change from Positive on June 2nd to Neutral to the end of August. See additional seasonality charts later in this report.
Short term short term indicators for U.S. equity indices, commodities and sectors (20 day moving averages, short term momentum indicators) moved higher last week.
Intermediate term technical indicator for U.S. equity markets (e.g. Percent of S&P 500 stocks trading above their 50 day moving average) moved higher last week. It remained Overbought. See Barometer charts at the end of this report.
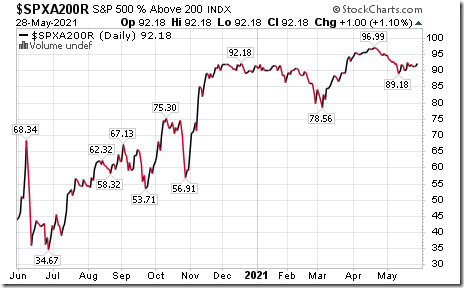
Long term technical indicator for U.S. equity markets (e.g. Percent of S&P 500 stocks trading above their 200 day moving average) moved slightly higher last week. It remained Extremely Overbought. See Barometer chart at the end of this report.
Short term momentum indicators for Canadian indices and sectors were virtually unchanged last week.
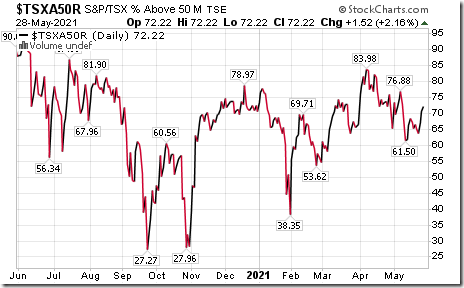
Intermediate term technical indicator for Canadian equity markets moved higher last week. It remains Overbought. See Barometer chart at the end of this report.
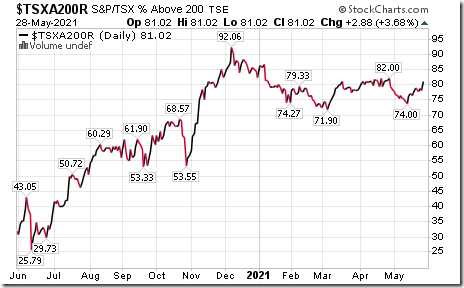
Long term technical indicator for Canadian equity markets (i.e. Percent of TSX stocks trading above their 200 day moving average) moved higher again last week. It changed on Friday from Overbought to Extremely Overbought on a move above 80.00. See Barometer charts at the end of this report.
Economic News This Week
Monday: Holiday in the United States and United Kingdom
Tuesday: March Canadian GDP to be released at 8:30 AM EDT on Tuesday is expected to increase 1.0% versus a gain of 0.4% in February.
April Construction Spending to be released at 10:00 AM EDT on Tuesday is expected to increase 0.6% versus a gain of 0.2% in March.
May Manufacturing ISM to be released at 10:00 AM EDT on Tuesday is expected remain unchanged from April at 60.7.
Thursday: May ADP Non-farm Employment to be released at 8:15 AM EDT on Thursday is expected to drop to 650,000 from 742,000 in April.
Next estimate of first quarter Non-farm Productivity to be released at 8:30 AM EDT on Thursday is expected to increase to 5.5% from 5.4%.
May Non-manufacturing ISM to be released at 10:00 AM EDT on Thursday is expected to increase to 63.0 from 62.7 in April
Friday: May Non-farm Payrolls to be released at 8:30 AM EDT on Friday are expected to increase to 650,000 from 266,000 in April. May Private Non-farm Payrolls are expected to increase to 600,000 from 218,000 in April. May Unemployment Rate is expected to slip to 5.9% from 6.1% in April. May Average Hourly Earnings are expected to increase 0.2% versus a gain of 0.7% in April.
Canadian May Employment to be released at 8:30 AM EDT on Friday is expected to fall 22,500 versus a fall of 207,100 in April. May Unemployment Rate is expected to increase to 8.2% from 8.1% in April.
April Factory Orders to be released at 10:00 AM EDT on Friday is expected to slip 0.2% versus a gain of 1.1% in March.
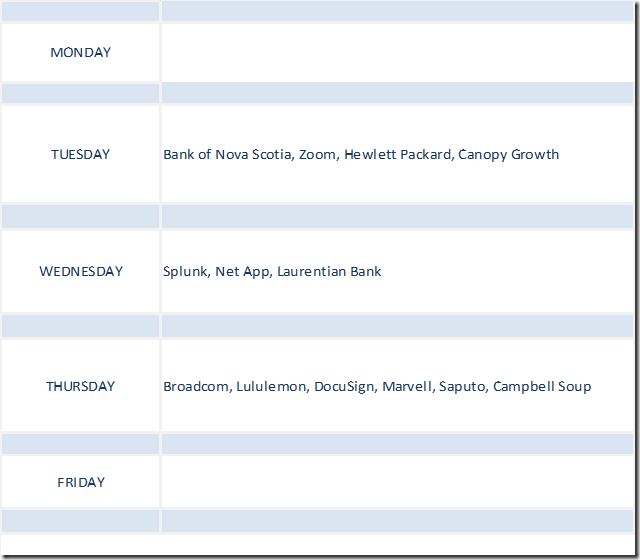
Selected Earnings News This Week
Trader’s Corner
Equity Indices and Related ETFs
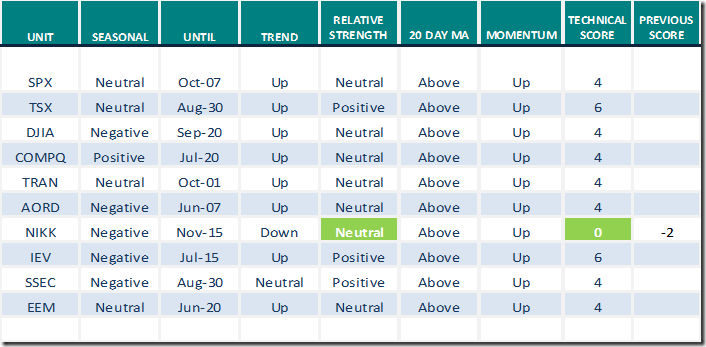
Daily Seasonal/Technical Equity Trends for May 28th 2021
Green: Increase from previous day
Red: Decrease from previous day
Commodities
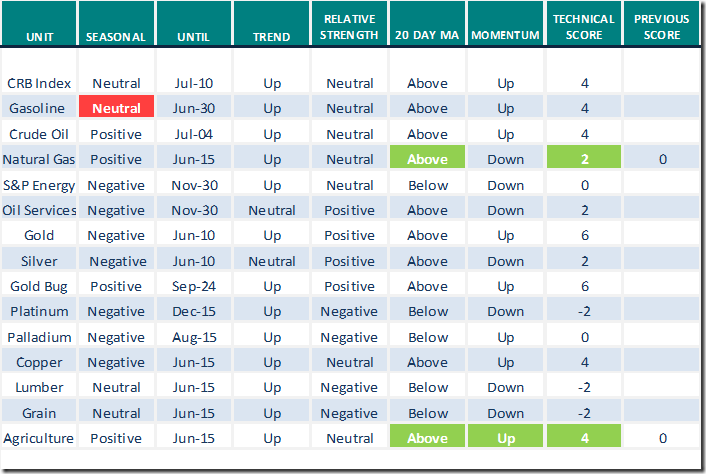
Daily Seasonal/Technical Commodities Trends for May 28th 2021
Green: Increase from previous day
Red: Decrease from previous day
Sectors
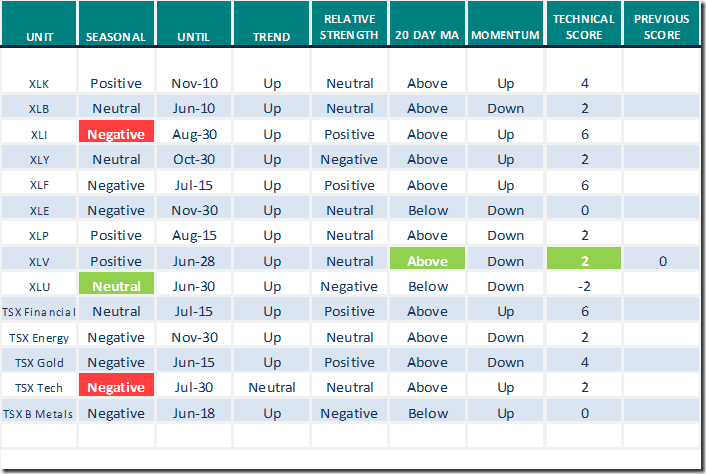
Daily Seasonal/Technical Sector Trends for May 28th 2021
Green: Increase from previous day
Red: Decrease from previous day
All seasonality ratings are based on performance relative to the S&P 500 Index
Technical Scoop
Thank you to David Chapman and www.EnrichedInvesting.com for a link to their weekly report.
Following is a link:
Technical Scores
Calculated as follows:
Intermediate Uptrend based on at least 20 trading days: Score 2
(Higher highs and higher lows)
Intermediate Neutral trend: Score 0
(Not up or down)
Intermediate Downtrend: Score -2
(Lower highs and lower lows)
Outperformance relative to the S&P 500 Index: Score: 2
Neutral Performance relative to the S&P 500 Index: 0
Underperformance relative to the S&P 500 Index: Score –2
Above 20 day moving average: Score 1
At 20 day moving average: Score: 0
Below 20 day moving average: –1
Up trending momentum indicators (Daily Stochastics, RSI and MACD): 1
Mixed momentum indicators: 0
Down trending momentum indicators: –1
Technical scores range from -6 to +6. Technical buy signals based on the above guidelines start when a security advances to at least 0.0, but preferably 2.0 or higher. Technical sell/short signals start when a security descends to 0, but preferably -2.0 or lower.
Long positions require maintaining a technical score of -2.0 or higher. Conversely, a short position requires maintaining a technical score of +2.0 or lower
Changes Last Week
Changes in Seasonality Ratings
TSX Composite Index: From Positive on June 2 to Neutral to August 30th on a real and relative basis.
S&P/TSX Composite Index Seasonal Chart
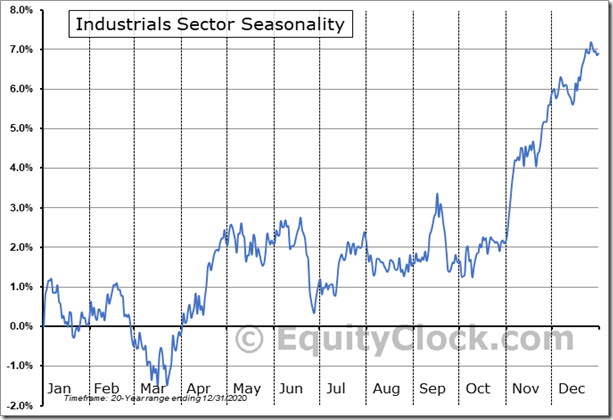
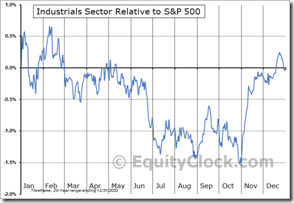
S&P Industrials: Positive on a real and relative basis on June 1st to Neutral on a real basis to October 1st and negative on a relative basis to August 30th
Industrials Sector Seasonal Chart
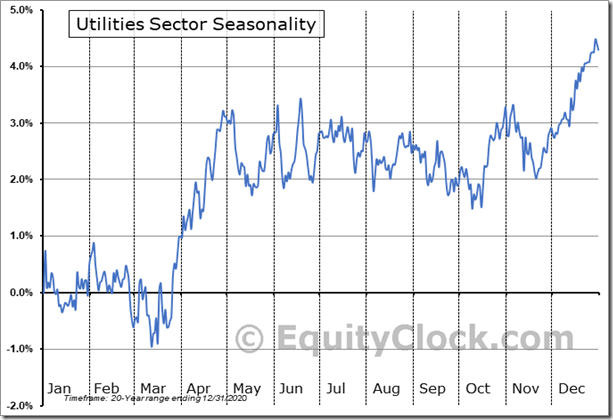
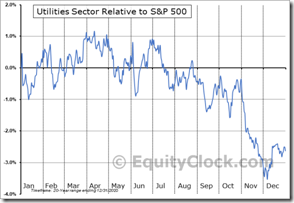
S&P Utilities: Negative on May 30th to Neutral on a real basis to October 2nd and Neutral on a relative basis to June 30th
Utilities Sector Seasonal Chart
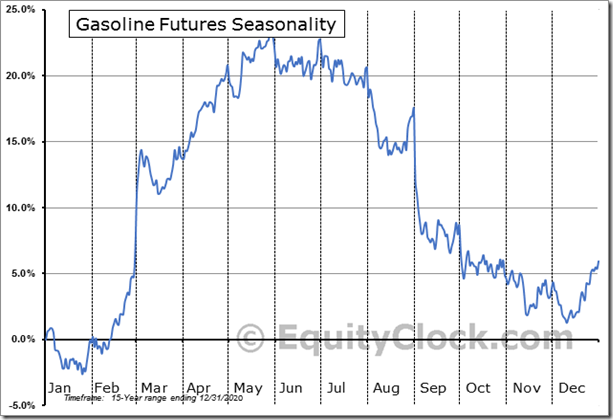
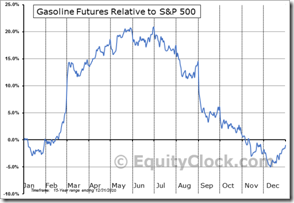
Gasoline: From Positive on May 29th to Neutral on a real and relative basis to June 30th
NY Harbor Blendstock RBOB Futures (RB) Seasonal Chart
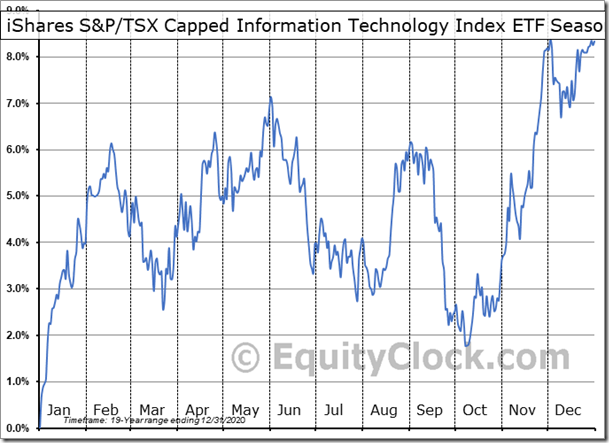
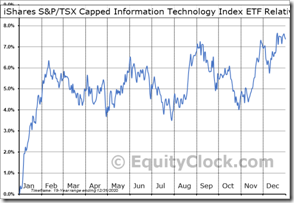
TSX Technology: Positive on May 30th to Negative on a real and relative basis to July 30th
Technical Notes released on Friday at StockTwits.com@EquityClock
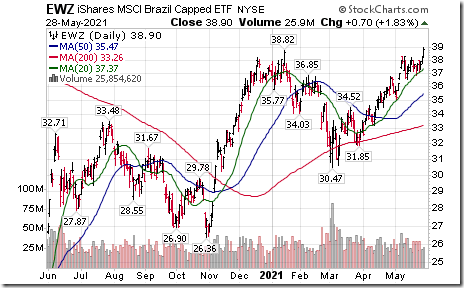
Brazil iShares $EWZ moved above $38.82 extending an intermediate uptrend.
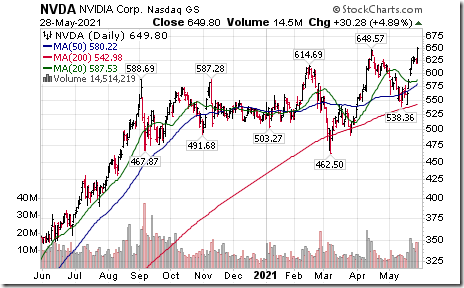
NVIDIA $NVDA a NASDAQ 100 stock moved above $648.57 to an all-time high extending an intermediate uptrend.
S&P 500 Momentum Barometers
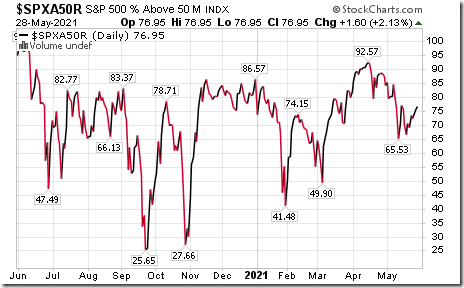
The intermediate Barometer added 1.60 on Friday and 7.61 last week. It remains Overbought.
The long term Barometer added 1.10 on Friday and 0.80 last week to 92.18. It remains Extremely Overbought.
TSX Momentum Barometers
The intermediate Barometer added 1.52 on Friday and gained 6.96 to 72.22 last week. It remains Overbought.
The long term Barometer added 2.88 on Friday and gained 2.15 to 81.02 last week. It changed on Friday from Overbought to Extremely Overbought on a move above 80.00.
Disclaimer: Seasonality and technical ratings offered in this report and at
www.equityclock.com are for information only. They should not be considered as advice to purchase or to sell mentioned securities. Data offered in this report is believed to be accurate, but is not guaranteed
This post was originally publised at Vialoux's Tech Talk.


