


Every year, investors are treated to a comparison between the performance of actively managed funds and the S&P 500 Index. The SPIVA® U.S. Scorecard[i], issued by S&P Dow Jones Indices, usually paints a pretty grim picture of active managers in the U.S. equity space.
This year’s report, covering performance to the end of 2018, was no different, finding that 64.49% of U.S. equity managers (in the U.S.) lagged the Index. The report cited the return of volatility as a contributing factor to this widespread underperformance.
This can lead to some uncomfortable client conversations for advisors about the role of active management.
So why on earth is Invesco bringing this up?
Firstly, we believe that looking at a single calendar year is far too simplistic – people do not generally buy their investments on January 2 and sell them on December 31.
Secondly, one year is a very short period, in terms of investment horizon. We believe most investors are in it for the long haul, and therefore long-term performance is what matters.
Thirdly, the report makes no mention of closet indexers – purportedly active funds that closely hug their respective benchmark. It can be very, very difficult for closet indexers to beat the index
And let’s leave aside the fact that you cannot invest in an index – even the lowest cost S&P 500 ETF charges a fee and will therefore underperform the index.
Long-term performance
While we cannot speak to the investment processes of our competitors, we can share our insights into what we believe is the key to strong long-term performance: a concentrated portfolio of deeply researched, high-conviction investments.
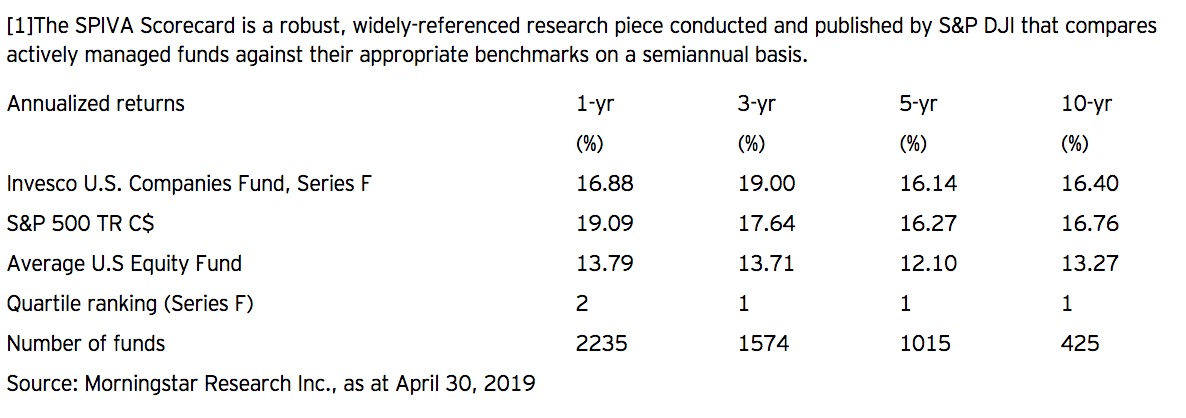
One such example is Invesco U.S. Companies Fund, which, over the long term, has handily beaten not only the Index, but the average return for U.S. equity funds.
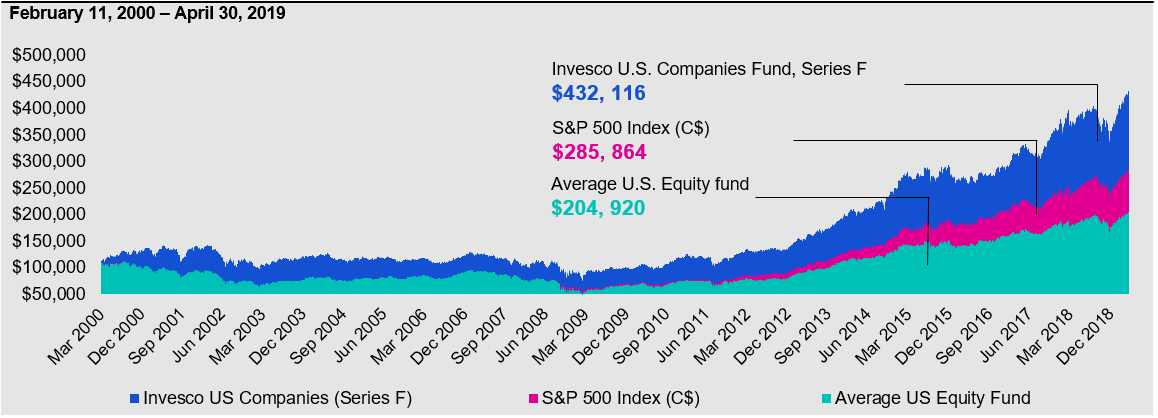
Source: Morningstar Research Inc. as at April 30, 2019. Category average is defined as the average of the funds within the Morningstar U.S. Equity category. You cannot invest directly in an index. The benchmark for the Fund is the S&P 500 Index (C$) and is used for comparison purposes against peer funds in the U.S. Equity category.
To aim for potential long-term results, veteran portfolio manager Jim Young seeks high-quality, growing companies that are focused on:
- Continual innovation and reinvestment, which can drive market share gains, enhance scale and reduce the business’ cost structure;
- Enhancing shareholders returns and growing free cash flow
The Fund will invest in such high-quality companies only if their valuations appear sensible. This helps avoid the risk of overpaying for growth, which can lead to permanent loss of capital.
Portfolio risk is also addressed through diversification and ensuring the Fund is not overexposed to any specific business risk.
Cash holdings are kept to a minimum, as a build-up of sidelined capital risks missing out on potential growth.
A positive view on volatility
As mentioned above, the SPIVA report cited volatility as a contributing factor to the majority of funds lagging the Index.
As true active managers, we view volatility differently than our closet-indexing competitors. A volatile market can provide the opportunity to invest at attractive prices and potentially upgrade the quality of our portfolio.
We greet volatility. We welcome it into the market, and we view it as our friends.
It’s nice to see it back again.
Invesco U.S. Companies Fund highlights
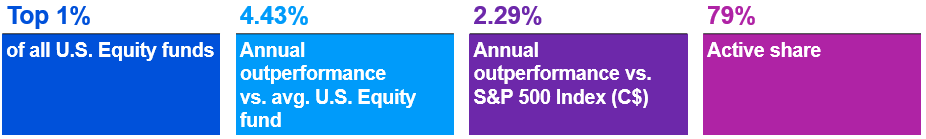
Sources: Morningstar Research Inc. and FactSet Research Systems Inc., as at April 30, 2019. Calculation benchmark: The benchmark for the Fund is the S&P 500 Index (C$) and is used for comparison purposes against peer funds in the U.S. Equity category. You cannot invest directly in an index. Invesco U.S Companies Fund is 1st percentile since manager inception. Time period is from March 1, 2000.
Source: Morningstar Research Inc., as at April 30, 2019
This post was originally published at Invesco Canada Blog
Copyright © Invesco Canada Blog