




Canadian ETF investors moved decisively during the week of November 9 to 13. According to Cboe's Canada Weekly ETF Flows report for Week 461, prepared by Edouard Caillieux using Trackinsight data, equity ETFs attracted C$2.83 billion in net inflows, while fixed income recorded the largest asset-class outflow at C$665.5 million. The report shows the divergence was not incidental. It reflects deliberate repositioning across geographies, sectors, and themes, with risk appetite firmly in charge.
Equities Dominate, Fixed Income Retreats
The headline number was equity-driven, but Caillieux's data reveals something more specific than a broad risk-on trade. Multi-asset ETFs added C$278.2 million and commodity ETFs contributed C$14.8 million, while cryptocurrency ETFs saw C$68.5 million in outflows, currency ETFs lost C$27.3 million, and volatility products shed C$3.7 million. Fixed income outflows at C$665.5 million carry the week's clearest signal: investors moved away from duration and credit in meaningful size.
Within fixed income, the breakdown is stark. The report notes that Corporate Investment Grade ETFs recorded the largest outflow at C$616.7 million, followed by Government Aggregate at C$55.8 million. On the inflow side, Corporate Aggregate ETFs led with C$54.8 million, followed by Government Investment Grade at C$41.8 million. The pattern Caillieux identifies suggests a selective retreat from established credit positions rather than wholesale fixed income aversion.
Technology Leads, Communication Services Bleeds
Sector flows produced one of the week's sharpest divergences. Caillieux reports that Information Technology led all sector inflows at C$107.7 million, followed by Financials at C$71.5 million and Materials at C$61.8 million. Communication Services recorded the largest sector outflow at C$480.3 million, a figure that dwarfs every other sectoral move in absolute terms.
Performance backed the rotation. The report shows Information Technology gained 4.17% on the week, Industrials rose 3.98%, and Energy added 3.94%. Materials declined 5.31%, the weakest sector of the week, while Communication Services fell 1.27%. Investors appeared to respond to real-time performance signals while simultaneously exiting Communication Services at a scale suggesting more than tactical trimming.
The Geography of Capital
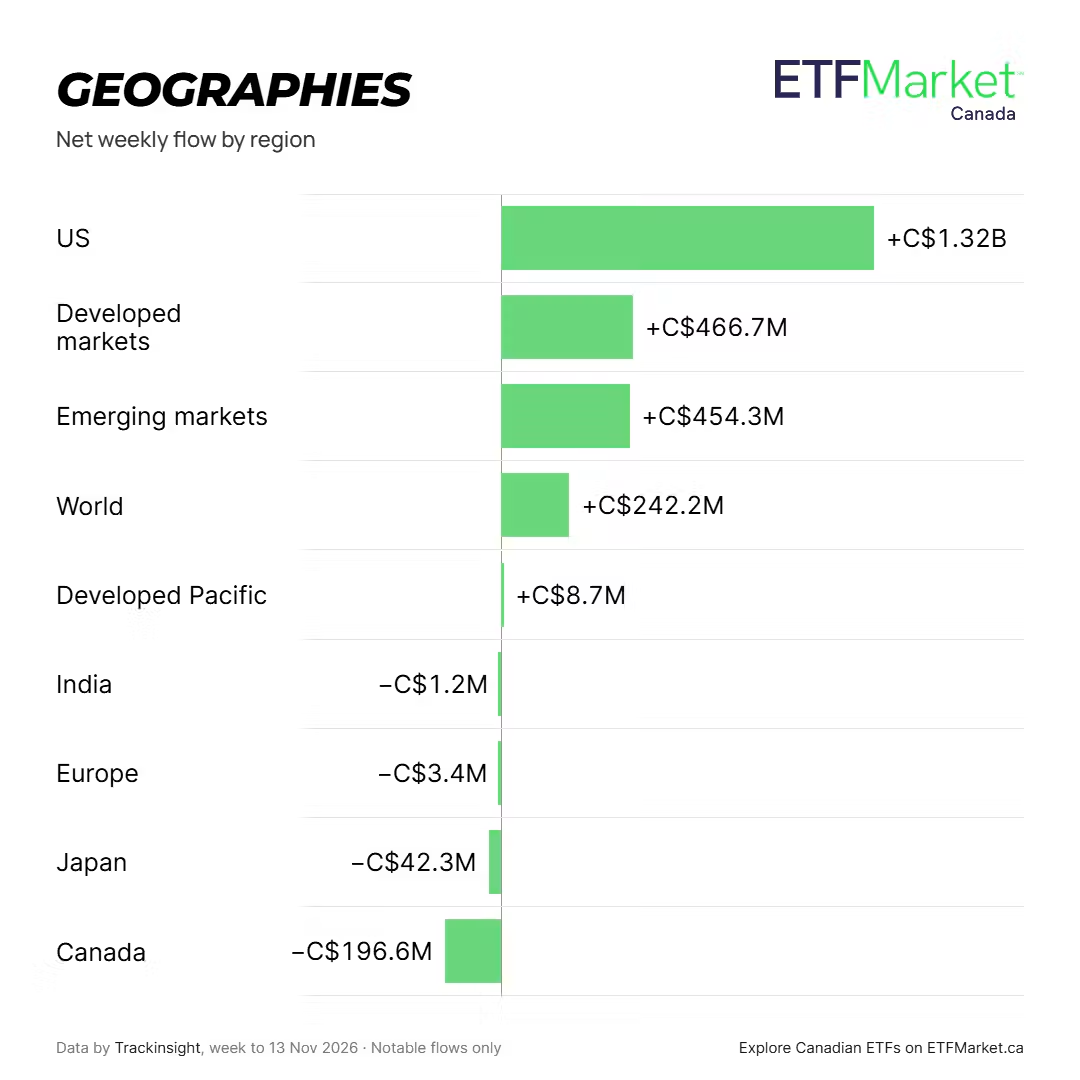
U.S.-focused equity ETFs attracted C$1.32 billion, the strongest geographic destination of the week. Caillieux notes that Developed markets followed at C$466.7 million, Emerging markets at C$454.3 million, and World exposure at C$242.2 million. Canada recorded the largest geographic outflow at C$196.6 million, followed by Japan at C$42.3 million.
The performance map tells a different story. The report finds that Asia led geographic returns with a 9.00% gain, South Korea followed at 8.15%, Japan at 5.72%, and Developed Pacific at 5.30%. Emerging markets returned 3.86%. Greater China was the weakest geographic exposure, falling 6.42%. The disconnect between Asia's performance leadership and the continued preference for U.S. and Developed market allocations reflects a tension advisors will recognize: strong short-term returns from Asia have not yet translated into sustained conviction flows.
Infrastructure Anchors Thematic Flows
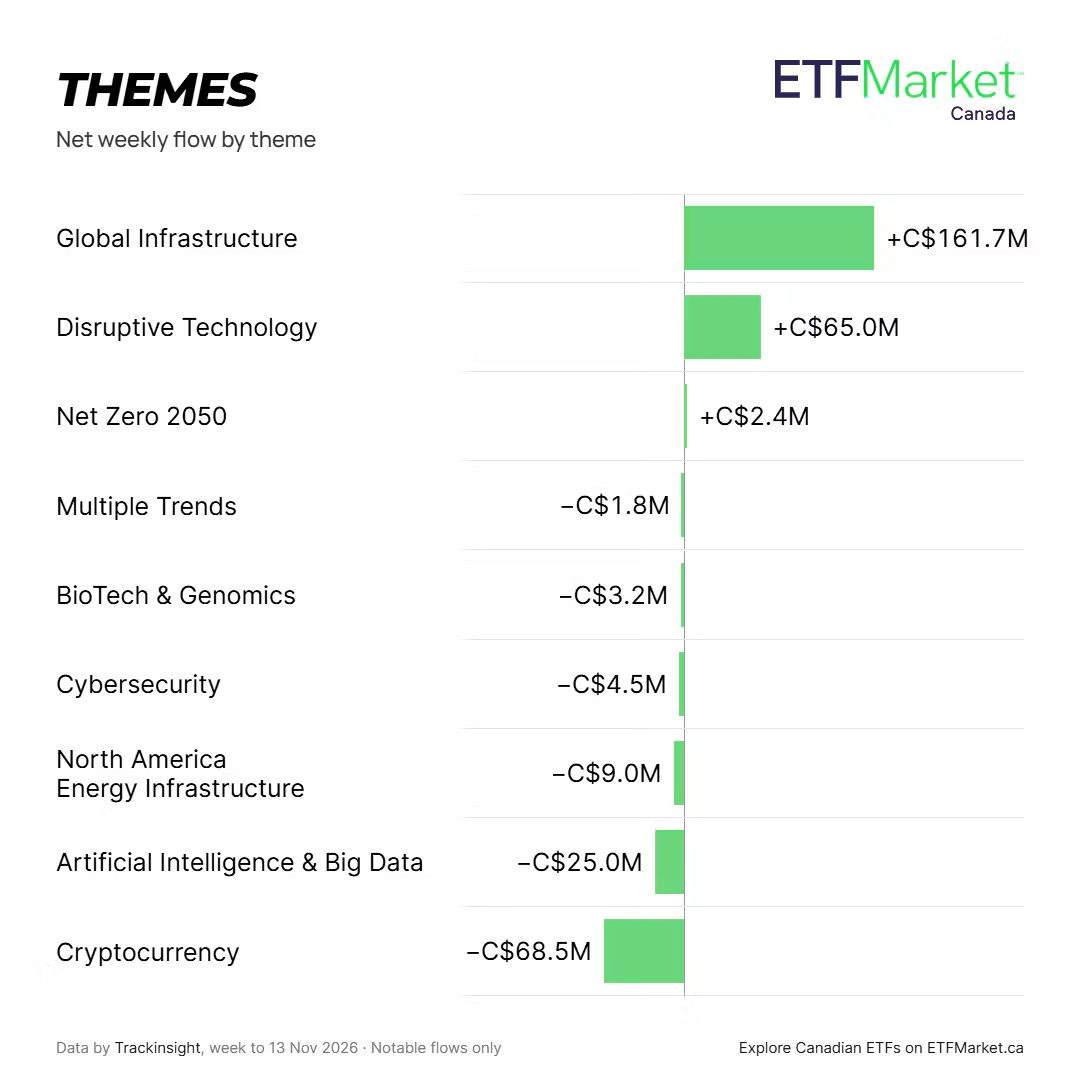
Global Infrastructure led thematic inflows with C$161.7 million, followed by Disruptive Technology at C$65.0 million. Caillieux's data shows Cryptocurrency recorded the largest thematic outflow at C$68.5 million, while Artificial Intelligence and Big Data saw C$25.0 million exit despite leading thematic performance at 6.25% for the week. Space led all thematic returns at 6.72%.
The crypto divergence is pronounced. The report indicates XRP led cryptocurrency product inflows at C$3.1 million, while Ether recorded the largest outflow at C$40.4 million and Bitcoin lost C$32.7 million. Capital rotated within crypto rather than exiting uniformly.
Issuer and ETF Leadership
Caillieux's issuer rankings show Vanguard led all issuers with C$769.4 million in net inflows, followed by Fidelity at C$653.0 million and Scotia Bank at C$484.7 million. TD Asset Management attracted C$284.2 million, Dynamic Funds C$275.4 million, Mackenzie Investments C$162.8 million, iShares C$155.3 million, BMO C$152.2 million, Desjardins Investments C$136.5 million, and CIBC C$128.2 million.
At the individual ETF level, the report finds that BMO MSCI Emerging Markets Index ETF (ZEM) led with C$264.0 million, followed by iShares S&P/TSX 60 Index ETF (XIU) at C$256.0 million and Scotia International Equity Index Tracker ETF (SITI) at C$214.3 million. On performance, Caillieux notes that Global X Artificial Intelligence Memory Index ETF (DRAM) led all ETFs with an 11.74% weekly gain, iShares Semiconductor Index ETF (XCHP) returned 10.50%, and iShares A.I. Innovation and Tech ETF (XBAI) gained 9.72%.
Top 10 Issuers by Weekly Net Inflows
- Vanguard: C$769.4M
- Fidelity: C$653.0M
- Scotia Bank: C$484.7M
- TD Asset Management: C$284.2M
- Dynamic Funds: C$275.4M
- Mackenzie Investments: C$162.8M
- iShares: C$155.3M
- BMO: C$152.2M
- Desjardins Investments: C$136.5M
- CIBC: C$128.2M
Top 10 Canadian ETFs by Weekly Inflows
- BMO MSCI Emerging Markets Index ETF (ZEM): C$264.0M
- iShares S&P/TSX 60 Index ETF (XIU): C$256.0M
- Scotia International Equity Index Tracker ETF (SITI): C$214.3M
- Scotia Canadian Large Cap Equity Index Tracker ETF (SITC): C$203.8M
- Mackenzie US Large Cap Equity Index ETF (QUU): C$202.8M
- Scotia US Equity Index Tracker ETF (SITU): C$196.1M
- Fidelity Global Equity+ Fund (FGEP): C$173.0M
- Mackenzie GQE International Equity ETF (MIQE): C$163.2M
- BMO S&P 500 Index ETF (ZSP): C$159.0M
- Dynamic Active Global Infrastructure ETF (DXN): C$151.4M
Top 10 Canadian ETFs by Weekly Performance
- Global X Artificial Intelligence Memory Index ETF (DRAM): +11.74%
- iShares Semiconductor Index ETF (XCHP): +10.50%
- iShares A.I. Innovation and Tech ETF (XBAI): +9.72%
- Global X Asia Semiconductor Index ETF (ACHP): +9.00%
- TD Global Technology Innovators Index ETF (TECI): +8.57%
- Global X Korea KOSPI 200 Index ETF (KORX): +8.15%
- iShares MSCI USA Momentum Factor Index ETF (XMTM): +7.71%
- Global X Artificial Intelligence Semiconductor Index ETF (CHPS): +7.31%
- CI Morningstar Global Next Gen AI Index ETF (INAI): +7.26%
- Global X Space Tech Index ETF (ORBX): +6.72%
5 Key Takeaways for Advisors and Investors
- Fixed income rotation is real and sizable. The C$665.5 million outflow from fixed income, led by a C$616.7 million exit from Corporate Investment Grade, signals that investors are actively reassessing duration and credit exposure in a shifting rate environment.
- Technology conviction is building, not retreating. Despite AI and semiconductor themes seeing some thematic outflows, individual ETF performance leaders were overwhelmingly tech and AI-oriented, with DRAM, XCHP, and XBAI topping the performance table.
- The U.S. remains the dominant equity destination. C$1.32 billion into U.S.-focused equity ETFs dwarfed every other geographic allocation, even as Asia produced the week's strongest geographic returns. Advisors should monitor whether Asia's performance edge begins to attract conviction flows.
- Communication Services outflows deserve attention. A C$480.3 million single-sector outflow is not noise. It points to a structural reassessment of that sector's role in Canadian ETF portfolios and may warrant client-level portfolio review.
- Infrastructure is functioning as a conviction theme. Global Infrastructure's C$161.7 million in thematic inflows, anchored by Dynamic Active Global Infrastructure ETF (DXN) at C$151.4 million, suggests investors are treating infrastructure as a durable allocation rather than a short-cycle trade.
Footnote:
1 Caillieux, Edouard. "Canada Weekly ETF Flows | November 9-13, 2026." Cboe ETF Market Canada, 16 Nov. 2026, https://etfmarket.cboe.com/canada/en/news/canada-weekly-etf-flows-november-9-13-2026?utm_source=account_engagement&utm_medium=email&utm_campaign=etfmarket_newsletter_nov_16.
Note from source: This article was prepared on November 16th, 2026 using Trackinsight ETF data. It is for informational purposes only and does not constitute investment advice. Please consult a registered financial professional before making any investment decision.