





by Jeff Buchbinder, Chief Equity Strategist, LPL Financial
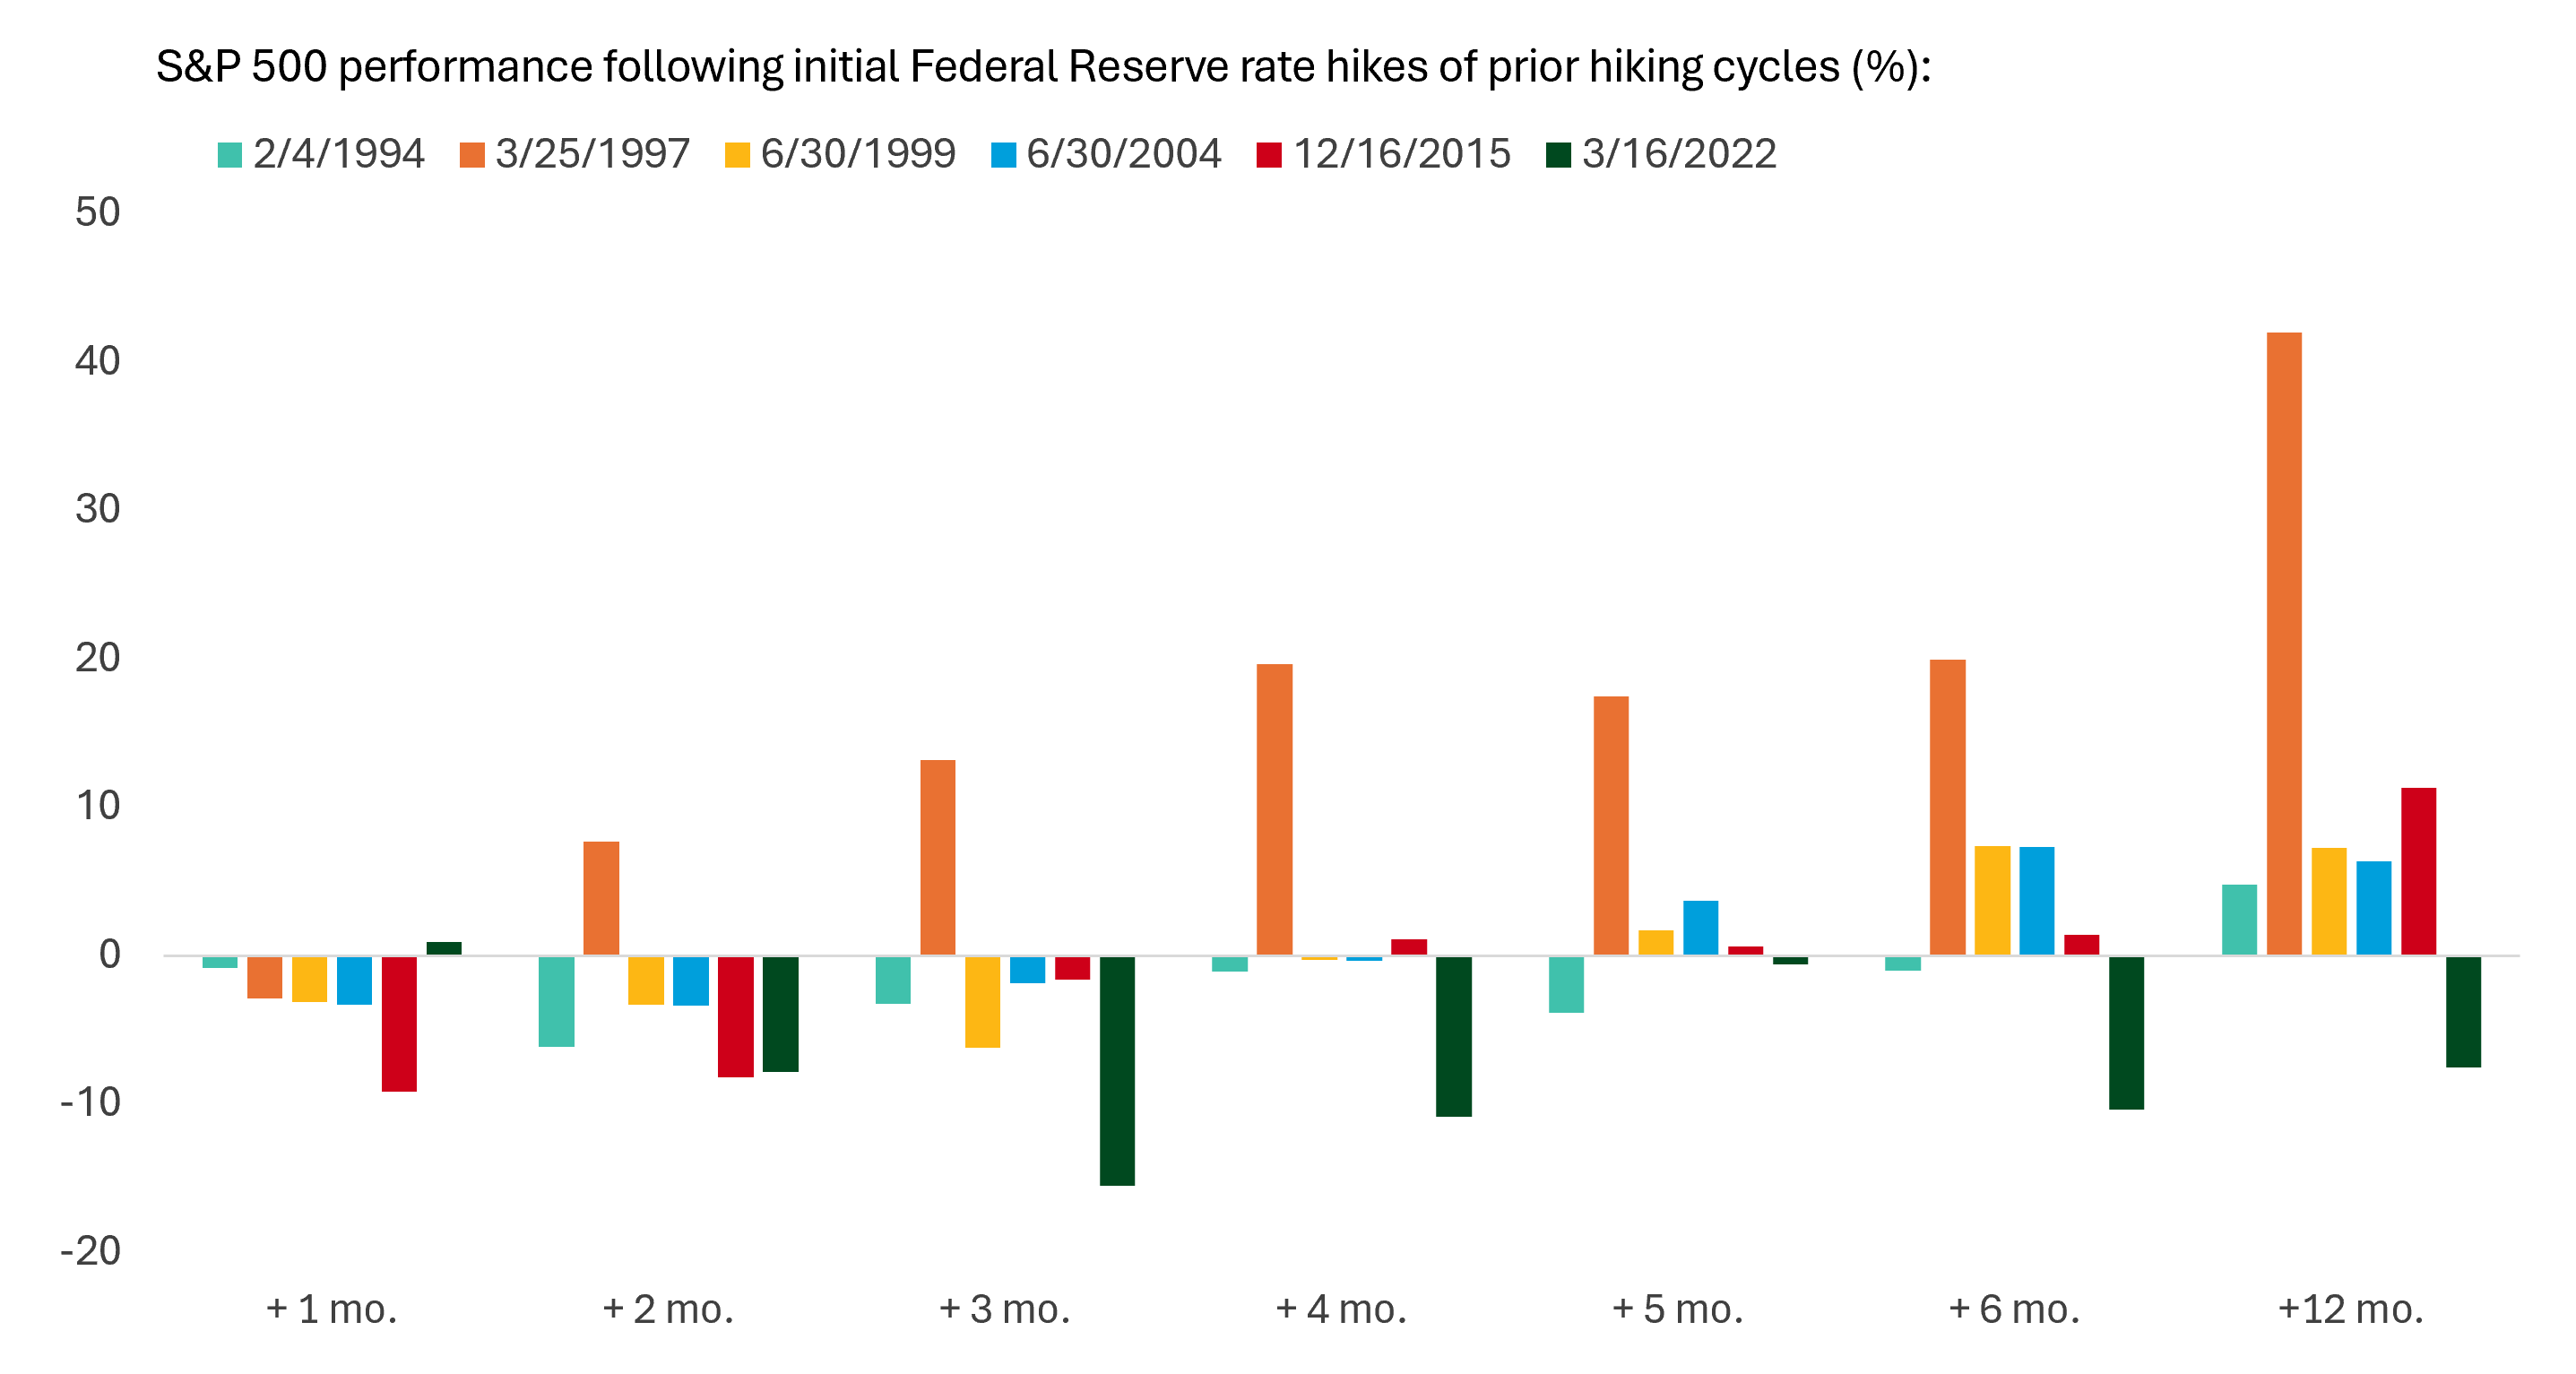
With so much attention focused on what the Federal Reserve (Fed) might do at its policy meeting next week, it’s a good time to look back at history to get a sense of how stocks might respond should the Fed hike rates as the market (barely) expects. LPL Research had been characterizing the rate decision as a coin flip until Chair Warsh’s hawkish comments at the Jackson Hole meeting and the strong August jobs report released last week. With the Fed fund futures market pegging the odds of a hike at 61% currently, we now believe the odds do, ever so slightly, favor a hike.To get a sense of how stocks might react if the Fed does indeed hike next week, we looked back at how the S&P 500 performed after initial Fed rate hikes over the past 30 years. As illustrated in the “Initial Fed Rate Hikes Have Generally Been Well Tolerated by the Stock Market” chart, it’s clear that stocks typically struggle for a few months before regaining their footing about five months out.
Initial Fed Rate Hikes Have Generally Been Well Tolerated by the Stock Market
 Source: LPL Research, Bloomberg, 09/08/26
Disclosures: Past performance is no guarantee of future results. All indexes are unmanaged and cannot be invested in directly.During the six tightening cycles since 1994, stocks generally struggled during the first several months following the initial rate increase. On average, returns were negative through the first four months before improving significantly by five to six months after the initial hike.Importantly, those early challenges have not typically translated into longer-term losses. In most cases, equity markets ultimately recovered and delivered healthy returns over the subsequent 12 months as investors adjusted to higher borrowing costs and focused on the underlying strength of the economy and earnings. The average 12-month gain for the S&P 500 post-hike is 6.7%, with a median of 10.7%. It’s important to use the median statistic in this case because of the 42% gain in the S&P 500 after the initial rate hike in March 1997. More on that below.
Two Notable Exceptions
Among these historical analogues, two periods stand out for different reasons. First, the bad news. After the initial hike in March 2022, the S&P 500 fell over the subsequent two months and stayed down for more than 12 months. Stocks faced a uniquely difficult backdrop, with long-term rates rising from severely depressed levels as inflation surged to multi-decade highs following the pandemic. The Fed was late to respond (remember how “transitory” became a bad word?) and was forced to tighten aggressively to catch up. The Fed’s poor track record of “hiking until something breaks” left markets fearful that a recession was in the offing. Not only did it feel like a recession to most consumers and investors, but the stock market’s 25% drawdown was consistent with one. Although the U.S. economy did not technically enter a recession in 2022, the environment today is clearly much different than it was then.The second notable exception to the general trends noted above came in 1997, when stocks significantly outperformed the other tightening cycles. Not only was the S&P 500 up nearly 8% two months later as the dot-com boom picked up speed, but a year after that initial hike, the S&P 500 was up 42%! Internet optimism carried the day, not too dissimilar from the AI-driven environment we are in today. In the battle between higher interest rates and revolutionary technologies, technology can win for a while. In fact, another hike in 1999 was followed by another 12-month gain in the S&P 500, reminding us how long the bubble inflated before it eventually popped in the spring of 2000.Some observers point to the Fed's June 1999 rate hike as a catalyst for the eventual bursting of the bubble. While we would acknowledge that tighter monetary policy likely contributed to market volatility, the enormous level of speculative investment and excessive capital spending would likely have ended that cycle at around the same time regardless of monetary policy actions.
Lessons Learned
The key lesson from these prior cycles is that rate hikes do not typically derail bull markets. When rate increases coincide with rising recession risks, that’s a different story. Today, recession risks are low by all accounts. Economic growth remains solid, labor markets remain healthy (as reinforced by last week’s jobs report), and inflation, though high, is far below the peaks reached in 2022. Meanwhile, interest rates are already much higher than they were at the start of the last tightening cycle, reducing the shock value for bond portfolios in the case of modest additional increases in market-based rates like the 10-year Treasury.While we won’t forecast a 40% rally in the next year, whether we get a hike next week or not, it’s clear to us that the current environment shares more characteristics with the late-1990s experience than the challenges of 2022. While no historical period offers a perfect comparison, today's combination of economic resilience and moderating inflation suggests the backdrop for equities remains supportive. History rhymes. We might get one hike. We might get two. But we won’t get 5.25% worth as we did in 2022 and 2023 (that’s the equivalent of 21 quarter-point hikes, but who’s counting?).
The Bottom Line
Markets expect Fed Chair Kevin Warsh and his Federal Open Market Committee (FOMC) colleagues to raise rates next week, and potentially again by December or in the first quarter of 2027. While additional hikes could create periods of volatility, history suggests that strong economic fundamentals can help offset the headwinds from higher rates. During past tightening cycles, stocks often experienced initial turbulence following the initial rate increase before regaining their footing. As long as economic growth remains intact and recession risks stay contained, equity markets have historically been able to move higher even in a rising-rate environment.
Copyright © LPL Financial
Important Disclosures
This material is for general information only and is not intended to provide specific advice or recommendations for any individual. There is no assurance that the views or strategies discussed are suitable for all investors. To determine which investment(s) may be appropriate for you, please consult your financial professional prior to investing.
Investing involves risks including possible loss of principal. No investment strategy or risk management technique can guarantee return or eliminate risk.
Indexes are unmanaged and cannot be invested into directly. Index performance is not indicative of the performance of any investment and does not reflect fees, expenses, or sales charges. All performance referenced is historical and is no guarantee of future results.
This material was prepared by LPL Financial, LLC. All information is believed to be from reliable sources; however LPL Financial makes no representation as to its completeness or accuracy.
Unless otherwise stated LPL Financial and the third party persons and firms mentioned are not affiliates of each other and make no representation with respect to each other. Any company names noted herein are for educational purposes only and not an indication of trading intent or a solicitation of their products or services.
Asset Class Disclosures –
International investing involves special risks such as currency fluctuation and political instability and may not be suitable for all investors. These risks are often heightened for investments in emerging markets.
Bonds are subject to market and interest rate risk if sold prior to maturity.
Municipal bonds are subject and market and interest rate risk and potentially capital gains tax if sold prior to maturity. Interest income may be subject to the alternative minimum tax. Municipal bonds are federally tax-free but other state and local taxes may apply.
Preferred stock dividends are paid at the discretion of the issuing company. Preferred stocks are subject to interest rate and credit risk. They may be subject to a call features.
Alternative investments may not be suitable for all investors and involve special risks such as leveraging the investment, potential adverse market forces, regulatory changes and potentially illiquidity. The strategies employed in the management of alternative investments may accelerate the velocity of potential losses.
Mortgage backed securities are subject to credit, default, prepayment, extension, market and interest rate risk.
High yield/junk bonds (grade BB or below) are below investment grade securities, and are subject to higher interest rate, credit, and liquidity risks than those graded BBB and above. They generally should be part of a diversified portfolio for sophisticated investors.
Precious metal investing involves greater fluctuation and potential for losses.
The fast price swings of commodities will result in significant volatility in an investor's holdings.
This research material has been prepared by LPL Financial LLC.
Not Insured by FDIC/NCUA or Any Other Government Agency | Not Bank/Credit Union Deposits or Obligations | Not Bank/Credit Union Guaranteed | May Lose Value
For Public Use – Tracking: #1172424