




by Jurrien Timmer, Director of Global Macro, Fidelity Investments
Orient Express
That’s a wrap for my 3 week APAC roadshow (with a nice parting shot of Hong Kong below). I had many great conversations and my wonderful local hosts made this trip productive (although a tad long).

From Korea to Japan to Beijing to Shanghai to Taipei to Hong Kong, the conversations were all unique while at the same time covering similar topical issues.
A common question or theme was whether AI is a boom or bubble. My answer was boom but with an eye on the froth level. This sentiment was especially prevalent in Korea and Taiwan given the semiconductor-heavy indices there. From bubble risk and concentration risk, the focus was commonly how to diversify a portfolio within equities and beyond.
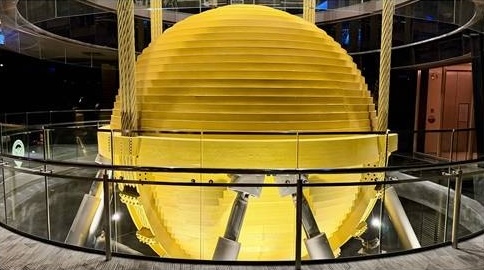
In that sense I got the perfect metaphor when my hosts took me to the 89th floor of the Taipei 101 building. As the photo at the top shows, on the top floor there is this massive yellow ball hanging from steel cables. Its purpose is to rebalance the tower when the wind is causing it to sway.
That’s what we need, right? A portfolio that zigs when the concentration and AI risks zag. Fortunately there is low hanging fruit there in the form of non-AI stocks and specifically eurozone financials. It’s hard to find a group less interesting than European banks, but they are doing their thing in terms of providing diversification and value while simultaneously having a successful catalyst of their own (rising payout ratio).
The other two main topics were the trajectory of monetary policy at the helm of Kevin Warsh, and the role of gold as diversifier (and why it hasn’t worked lately). The latter topic was especially prevalent in the final four cities of the tour and I was even asked whether American investors are as focused on gold as their Asian counterparts are (answer: not even close).
Let’s unpack these themes below. Given the late hour I will make this a speed round.

The periodic table below shows the leaderboard through June. EM, small caps, Japan at the top and Bitcoin, gold, and bonds at the bottom.

The US market has broadened nicely in recent weeks, with the Mag 7 taking a rest and the rest of the market in a solid uptrend. Breadth is now at a healthy 68%.

The Mag 7 has now gone sideways since last October, which has allowed the market to broaden in a positive way.

Earnings estimates are still moving higher, and with second quarter earnings season about to start it will be interesting to see what companies are saying about their AI buildout. At some point earnings will decelerate and that’s when the market will get tested in terms of how crowded the AI space is.

The S&P 500 index continues to trade at a 23x forward multiple, which is quite reasonable.

And the average stock (equal-weighted index) trades at a mere19x multiple. Other than concentration risk and the possibility of AI froth, there is really nothing not to like here.

The semiconductors remain on the frontline of the AI boom. Are they cyclical or secular? If cyclical, the low (20x) P/E tells us little about valuation (peak earnings = misleadingly low valuation). But if it’s secular, that’s a different story.

And here are the Mag 7, which trade at a 25x P/E. Not bad at all. All of this tells me that the boom is still a boom, even if it’s a concentrated one.

The first place to look for balance is simply the ex-AI space. On down days, those stocks go up. But for me, more intriguing is the boringest sector of all, those sleepy European banks (Bloomberg ticker SX7E). Even though it’s a value sector with a P/E of only 11x, it has been neck and neck with the AI trade. Why? Because these companies are unlocking shareholder value, making their payout ratio and CAGR on par with the S&P 500.

And this is happening at a time when the Mag 7 are burning through their cash for their CAPEX, leaving less and less for share buybacks.

Below we see that both the Eurozone banks and the S&P 500 ex-AI index show only a modest correlation to both the S&P 500 and Bloomberg LT Government bond index. They are true diversfiers.

Below is a chart of the SX7E. It’s correlation to the Mag 7 is only 19%, which is what we want for balance.

Moving to gold and why it hasn’t done what it’s supposed to do, I revisit below my charts from last week which shows that gold is “cheap” relative to the global money supply. With global M2 decelerating from a growth rate of 12% to 6% (and declining), the catalyst for gold is probably not there yet. With global monetary policy turning more hawkish, global liquidity might slow further.

It’s clear that the fast money that used to be in Bitcoin then went to gold, pushing the gold price far higher than global liquidity would justify. Now those speculators are in semiconductors. Whether we hold $4k or decline further, which, in my view, indicates gold may be worth accumulating here.

As for Bitcoin, it too may be in an accumulation zone (in my view). At $60k it’s getting ever closer to its power law support line.

This information is provided for educational purposes only and is not a recommendation or an offer or solicitation to buy or sell any security or for any investment advisory service. The views expressed are as of the date indicated, based on the information available at that time, and may change based on market or other conditions. Opinions discussed are those of the individual contributor, are subject to change, and do not necessarily represent the views of Fidelity. Fidelity does not assume any duty to update any of the information.
1267670.1.0
Copyright © Fidelity Investments