


by Lance Roberts, RIA
Over the last decade, there has been an ongoing fundamental debate about markets and valuations. The bulls have long rationalized that low rates and increased liquidity justify overpaying for the underlying fundamentals. For the last decade, that view appears correct as zero interest rates combined with massive monetary and fiscal support increased market returns by 50% since 2009. We discussed this point in “Long-Term Returns Are Unsustainable.” To wit:
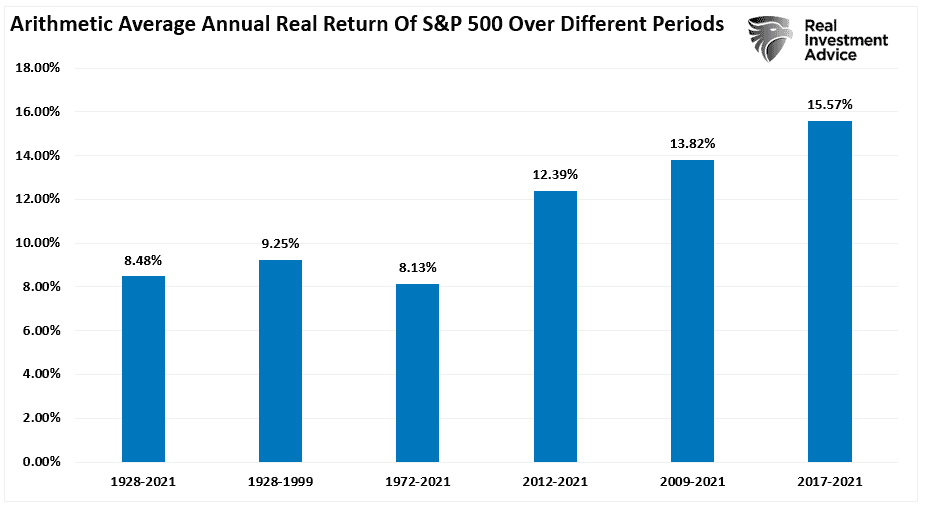
“The chart below shows the average annual inflation-adjusted total returns (dividends included) since 1928. I used the total return data from Aswath Damodaran, a Stern School of Business professor at New York University. The chart shows that from 1928 to 2021, the market returned 8.48% after inflation. However, notice that after the financial crisis in 2008, returns jumped by an average of four percentage points for the various periods.”
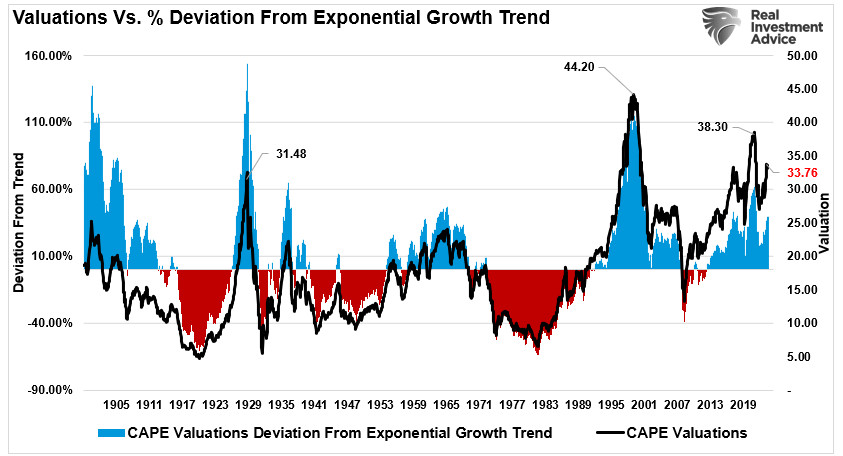
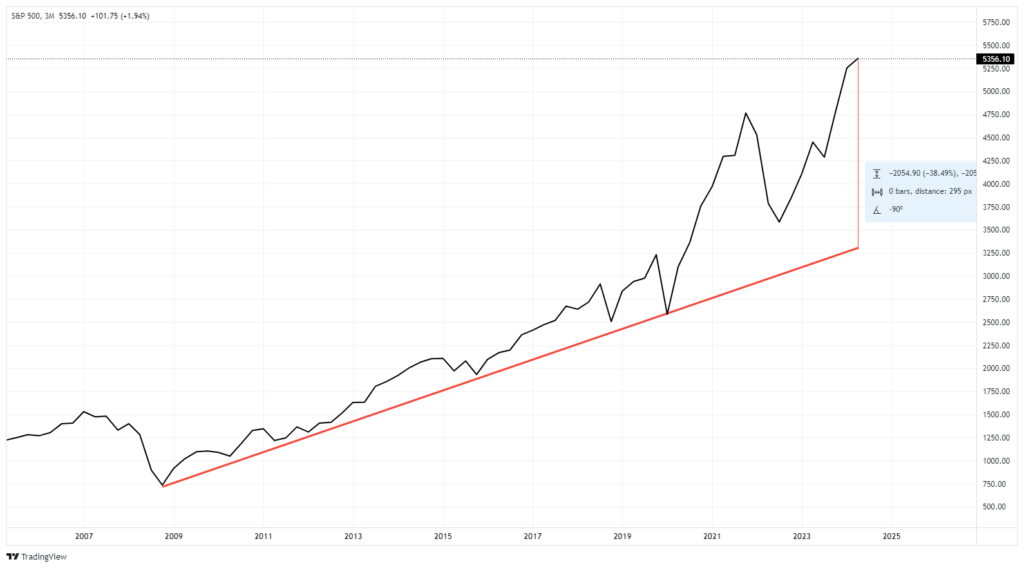
As noted, an unprecedented amount of monetary accommodation drove those excess returns. Unsurprisingly, this resulted in one of the most significant deviations from the market’s exponential growth trend.
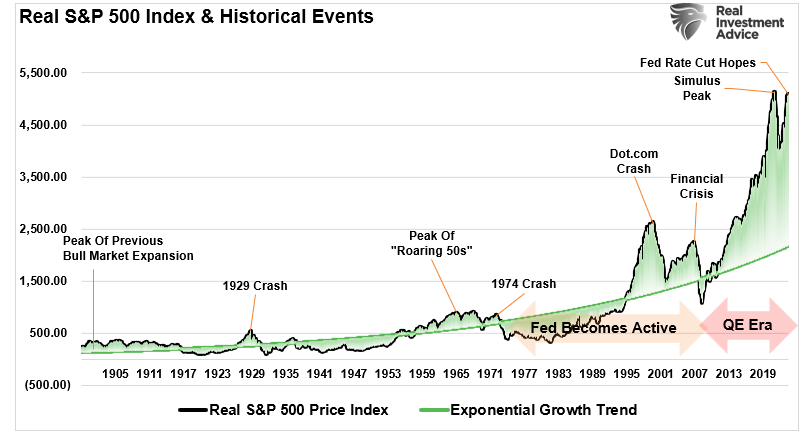
(Usually, when charting long-term stock market prices, I would use a log-scale to minimize the impact of large numbers on the whole. However, in this instance, such is not appropriate as we examine the historical deviations from the underlying growth trend.)
Wall Street Exuberance
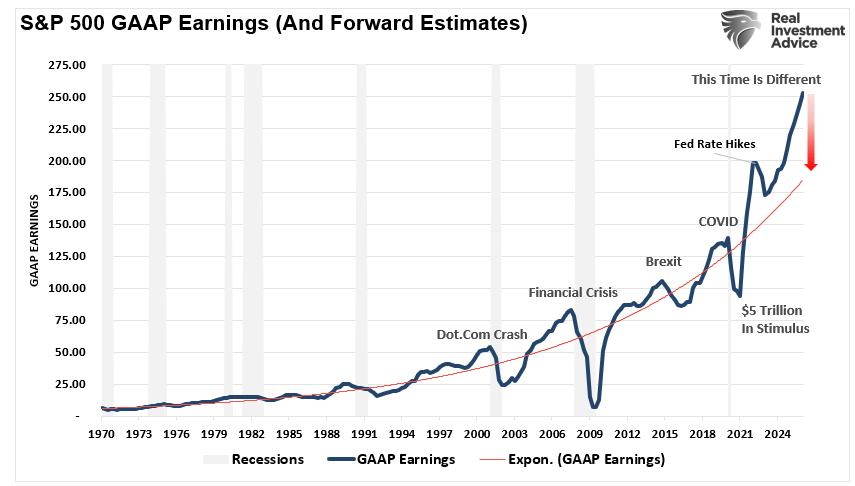
The fiscal policies implemented after the pandemic-driven economic shutdown created a surge in demand that further exacerbated an already extended market. As shown, those fiscal interventions led to an unprecedented surge in earnings, with current expectations through 2025 significantly extended.
Given that markets historically track the annual change in earnings, it is unsurprising that stocks have once again reached more extreme valuation levels, given the rather ebullient forecast. The table below, from BofA, shows 20 different valuation measures for the S&P 500 index. Except for market-based equity risk premium (ERP), every other measure is at some of the most extreme levels.
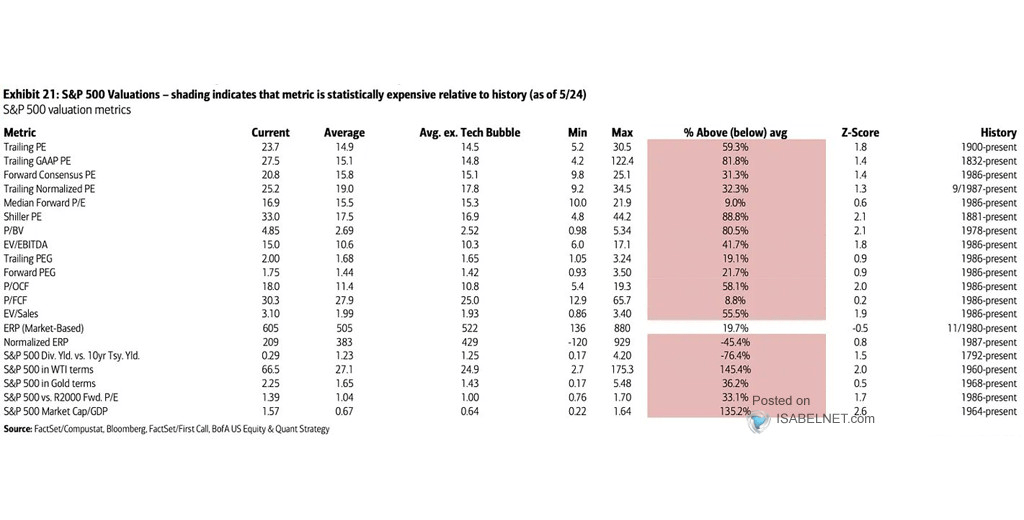
Unsurprisingly, when discussing more extreme fundamental valuations, the expectation is that a more significant correction will eventually occur. While historically, the markets have often experienced “mean reverting events,” we will explore how the past 20 years of monetary and fiscal interventions have potentially permanently shifted market valuations higher.
A Permanent Shift Higher
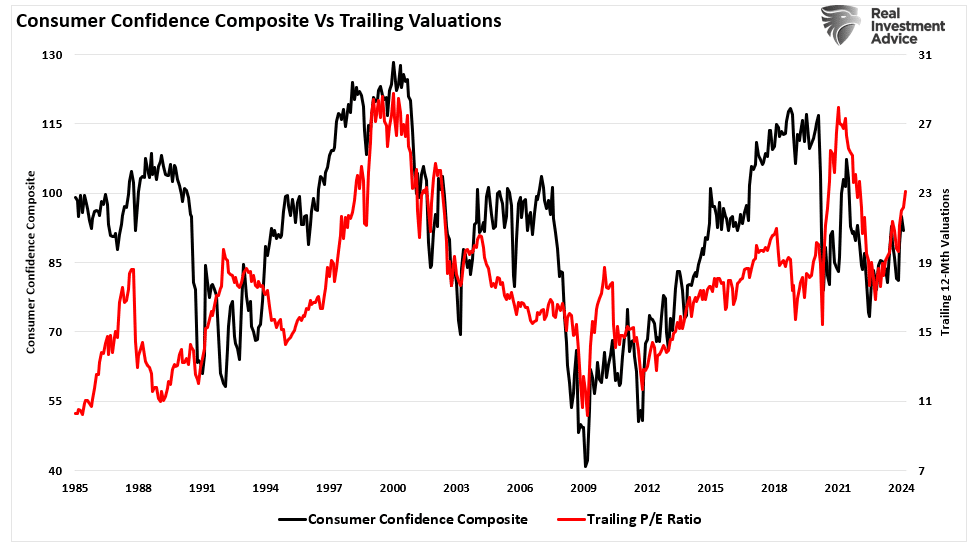
As discussed in “Technical Measures,“ valuations are a terrible market timing tool. Valuations only measure when prices are moving faster or slower than earnings. As we noted, in the short-term valuations are a measure of psychology. To wit:
“Valuation metrics are just that – a measure of current valuation. More importantly, when valuation metrics are excessive, it is a better measure of ‘investor psychology’ and the manifestation of the ‘greater fool theory.’ As shown, there is a high correlation between our composite consumer confidence index and trailing 1-year S&P 500 valuations.”
However, just because current valuations are elevated, does that mean a massive mean reverting event is required?
Maybe not.
Dr. Robert Shiller’s fundamental valuation method, using ten years of earnings, or the cyclically adjusted price-earnings ratio (CAPE), is over 33 times trailing earnings. While that valuation level seems elevated on a nominal basis, its deviation from the long-term exponential growth trend is not. While 33x earnings is a high price for future earnings (implying 33 years to break even), the reduced deviation from the long-term exponential growth trend exposes the shift higher in valuation levels.
There are many reasons why valuations have shifted higher over the years. The increase is partly due to economic expansion, globalization, and increased profitability. However, since the turn of the century, changes in accounting rules, share buybacks, and greater public adoption of investing (aka ETFs) have also contributed to the shift. Furthermore, as noted above, the massive monetary and fiscal interventions since the “Financial Crisis” created a seemingly “risk-free” environment for equity risk.
The chart shows the apparent shift in valuations.
- The “median” CAPE ratio is 15.04 times earnings from 1871-1980.
- The long-term “median” CAPE is 16.52 times earnings from 1871-Present (all years)
- The “median” CAPE is 23.70 times earnings from 1980 to the present.
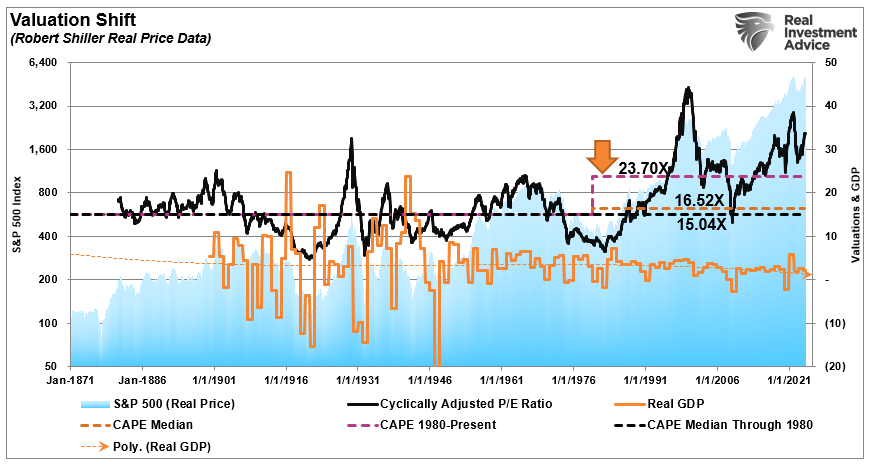
There are two critical things to consider concerning the chart above.
- The shift higher in MEDIAN valuations was a function of falling economic growth and deflationary pressures, and,
- Increasing levels of leverage and debt, which eroded economic growth, facilitated higher prices.
So, the question is, “IF” valuations have permanently shifted higher, what will the next market mean-reverting event look like to reset fundamental valuations to a more attractive level?
Mapping A Reversion To The Mean
Many video channels, commentators, and media types suggest another “major market correction” is coming. There are many reasons for their claims running the gamut, including de-dollarization, loss of the reserve currency, higher rates, debt defaults, etc. As we noted previously, while these are possibilities, they are pretty remote.
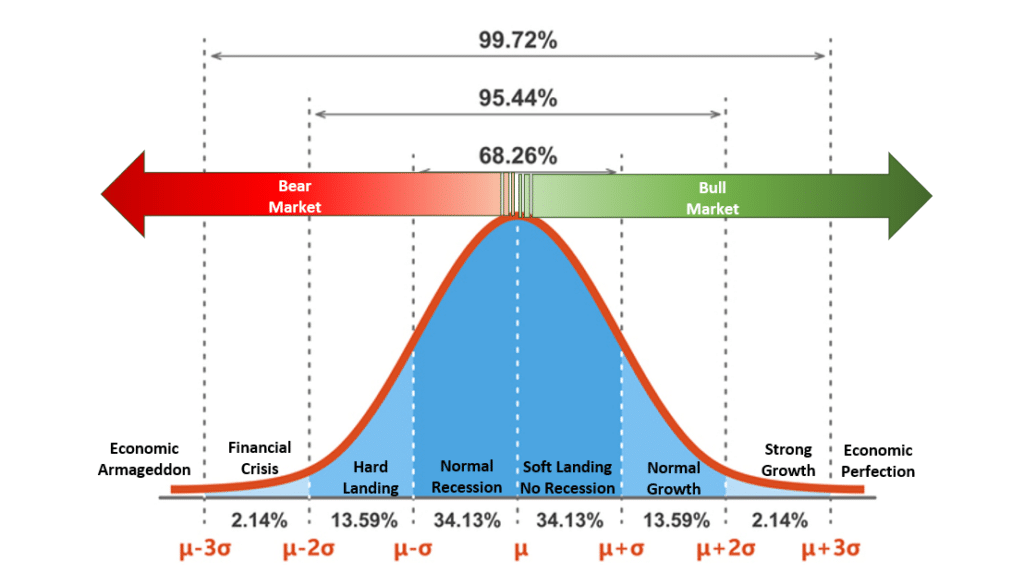
“The chart below is a normally distributed “bell curve” of potential events and outcomes. In simple terms, 68.26% of the time, typical outcomes occur. Economically speaking, such would be a normal recession or the avoidance of a recession. 95.44% of the time, we are most likely dealing with a range of outcomes between a reasonably deep recession and standard economic growth rates. However, there is a 2.14% chance that we could see another economic crisis like the 2008 Financial Crisis.
But what about “economic armageddon?”
That event where nothing matters but “gold, beanie weenies, and bunker.” That is a 0.14% possibility.“
While “fear sells,” we must assess the “probabilities” versus “possibilities” of various outcomes. Since valuations are a fundamental function of price and earnings, we can use the current price of the market and earnings to map out various valuation reversions.
As of this writing, the S&P 500 is trading at roughly $5,300 (we will use a round number for easy math). The projected earnings for 2024 are approximately $217/share. We can plot the price decline needed to revert valuations using the abovementioned median valuation levels.
- 23.70x = 5142.90 = 3% decline
- 16.52x = 3584.84 = 33% decline
- 15.04x = 3263.68 = 38.5% decline
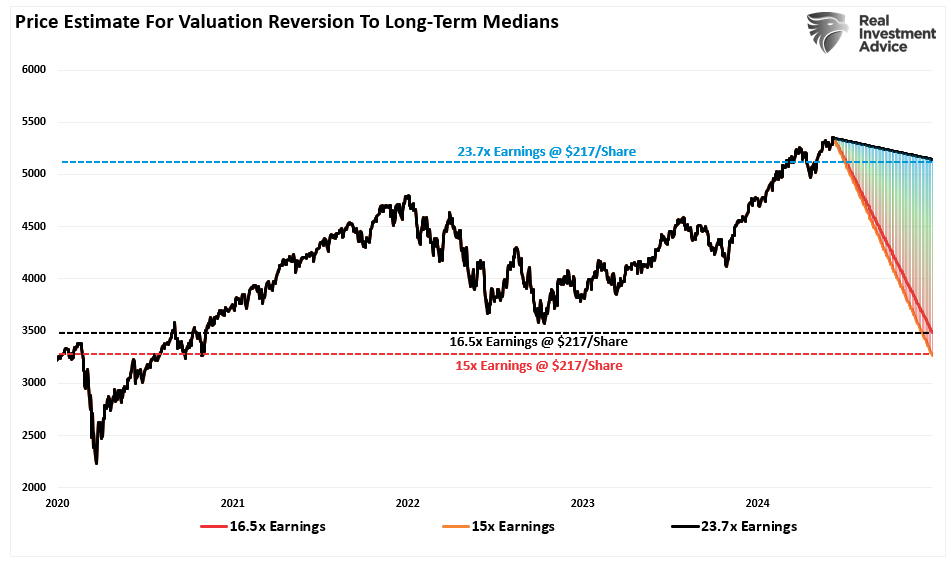
Here is the vital point.
While a near 40% decline in stocks is quite significant and would undoubtedly send the Federal Reserve scrambling to cut rates and restart “Quantitative Easing,” the reversion would only reverse the post-pandemic stimulus-driven gains. In other words, a near 40% correction would NOT be a “bear market” but just a correction in the ongoing bull market since 2009. (This shows how egregious the price deviation has become from the long-term price trend since the pandemic.)
Conclusion
While this is just a thought experiment, there are two critical takeaways.
- The deviation from the long-term means is extreme, suggesting a more significant decline is possible in the future and
- While valuations are elevated relative to long-term history, if there has been a permanent shift in valuations, the subsequent correction may not be as deep as some expect.
Importantly, investors repeatedly make the mistake of dismissing valuations in the short term because there is no immediate impact on price returns. As noted above, valuations, by their very nature, are HORRIBLE predictors of 12-month returns. Therefore, investors should avoid any investment strategy that has such a focus. However, in the longer term, valuations excellent predictors of expected returns.
From current valuation levels, investors’ expected rate of return over the next decade will be lower than it was over the past decade. That is unless the Federal Reserve and the government launch another massive round of monetary stimulus and cut interest rates to zero.
This does not mean that markets will produce single-digit rates of return each year for the next decade. There will likely be some tremendous investing years over that period and a couple of tough years in between.
That is the nature of investing and the market cycles.
Copyright © RIA