by Jeremy Schwartz, CFA, Global Chief Investment Officer, Associate Director, Research, WisdomTree
Many are drawn to large-cap stocks, especially the technology giants that have dominated the market in recent years. These mega-cap companies have shown impressive growth and resilience amid the pandemic and the economic downturn, while small caps have languished both in absolute and relative terms.
But there are some locations where small caps have done quite well, and they may surprise you. Small caps in emerging markets (EM) have shown strong performance and diversification benefits, as well as higher dividend yields and lower valuations than U.S. small caps.
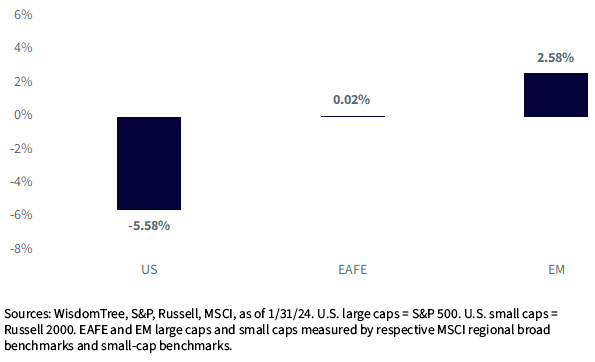
For all the talk of the “death” of the size factor, small caps have handily outperformed large caps in EM for the last decade.
Trailing 10-Year Returns: Small vs. Large Caps
In addition to the strong relative performance case, some other points we’ll review that may be surprising:
- Do small caps even pay dividends in emerging markets? The universe is quite large and broad-based. More than 80% of EM small caps pay a dividend, and the weighted average dividend yield is more than 5% on the WisdomTree EM SmallCap Dividend Index1
- Emerging market small caps had lower volatility than U.S. small caps as measured by the MSCI EM Small Cap Index compared to the Russell 2000 over the trailing 3-, 5- and 10-year standard deviations2
- While U.S. small-cap indexes are littered with many unprofitable companies, WisdomTree’s EM small-cap Index filters for profitable dividend payers that favor higher-quality companies as opposed to the more speculative titled U.S. small-cap indexes
Let’s drill into each of these points in more detail.
Performance: Five Stars
The WisdomTree Emerging Markets SmallCap Dividend Fund (DGS) received the prestigious five-star accolade from Morningstar, which is one way of quickly surmising it has strong risk-adjusted performance relative to its broad emerging market category.3
Over the last 10- and 15-year periods, DGS ranked in the top decile of the emerging markets category, with more than 2% per year better performance than the category average return.
Over the last three years, while the average emerging market fund had a -5% per year return, DGS had a +5.8% per year return—a dramatic spread of outperformance.
Morningstar Performance: WisdomTree Emerging Markets SmallCap Dividend Fund (DGS)
What are some of the drivers of this? Many of the major benchmarks and active funds had heavy exposure to the Chinese technology companies that came under significant pressure. Focusing on dividend payers avoided those stocks.
Dividends a Key Sign of Quality
The WisdomTree Emerging Markets SmallCap Dividend Fund (DGS) seeks to track the price and yield performance, before fees and expenses, of the WisdomTree Emerging Markets SmallCap Dividend Index.
Since the inception of the WisdomTree Emerging Markets SmallCap Dividend Index, it outperformed the broad emerging markets by 347 basis points annualized.
Almost half the outperformance came from the top dividend-yielding stocks, which our Index had more than 40% exposure to on average, whereas the cap-weighted Index had less than 16% exposure.
The stocks in our Index in this top-yielding quintile returned 7.36% per year, while the MSCI EM Index returned just 1.60% as a whole—showcasing the dividend factor as a key driver of relative returns.
Even more interesting were the zero dividend payers in EM, which averaged almost 10% of the weight of the broad EM Index and had -6.9% per year returns.
Index Dividend Yield Attribution: WisdomTree Emerging Markets SmallCap Dividend Fund vs. MSCI Emerging Markets Index
Russell 2000 vs. EM Small Caps
People don’t think of U.S. small caps and dividends going together. Only half of companies pay a dividend.4
The culture of paying dividends is much more prevalent in emerging markets.
DGS includes almost 1,000 companies with an average market cap similar to the levels in the Russell and a slightly higher median market cap.
The dividend yield averages more than 5% for DGS and just 1.4% for the Russell 2000.
Twenty-six percent of the Russell 2000 is not profitable, while less than 1% of DGS is not profitable.
Characteristics and Fundamentals Comparison
For the most recent month-end standardized performance, please click here.
Emerging market small caps are an attractive asset class for investors seeking diversification, growth potential and income. However, not all emerging market small caps are created equal, and some may expose investors to higher risks and lower returns.
EM Small Caps Lower Volatility Than U.S. Small Caps
You might think EM small caps involve a lot more risk than U.S. small caps, but the data on historical volatility shows DGS had lower volatility over all longer periods than U.S. small caps.
Over 10 years, DGS had similar volatility as broad EM large caps.
Volatility Comparison
For the most recent month-end standardized performance, please click here.
And over every standardized period, it had a down capture below 90%, cushioning some of the drawdown in down months for the MSCI EM Index.
Down Capture Comparison
The biggest sector difference between DGS and the Russell 2000 is in Health Care, where there are a vast number of unprofitable biotech companies in the U.S.
Relative to the MSCI EM Index, DGS has less exposure to Communication Services, Financials and Information Technology—sectors where major Chinese tech companies (Comm. Svcs. and Info. Tech.) and Chinese SOE banks (Financials) are populated.
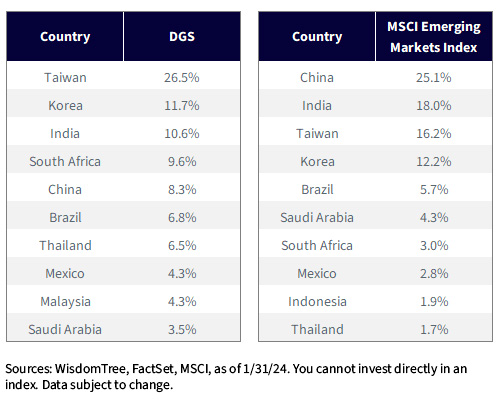
From a country perspective, we mentioned that the performance of DGS has benefited from both an absolute return and risk perspective by being underexposed to China—8% for DGS versus 25% for MSCI EM.
In exchange for less China exposure, there is an increased allocation to Taiwan, South Africa, Thailand and Malaysia.
For investors looking to minimize the China risk, DGS offers a compelling solution without having to make a single country or regional bet.
Country Comparison
Conclusion
Emerging market small caps are an attractive asset class for investors seeking diversification, growth potential and income. However, investors need to be selective and avoid the pitfalls of traditional market cap weighting, which can expose them to higher risks and lower returns.
DGS, the WisdomTree Emerging Markets SmallCap Dividend Fund, offers a dividend-weighted approach that aims to enhance the risk-return profile of emerging market small caps and deliver higher income and lower volatility than the broader benchmarks.
DGS outperformed the broader benchmarks thanks to its dividend-weighted methodology, sector and country allocation and exposure to value and quality factors.
1 Sources: WisdomTree, FactSet, MSCI, as of 1/31/24. Percent of EM small-cap dividend payers based on sum of index weight for dividend payers in the MSCI Emerging Markets Small Cap Index.
2 Sources: WisdomTree, MSCI, Russell, as of 1/31/24.
3 Morningstar Rating as of 1/31/24. Category: Diversified Emerging Markets. Overall rank based on 716 funds in category, 3-year percentile rank based on 716 funds in category, 5-year percentile rank based on 660 funds in category, 10-year percentile rank based on 402 funds in category.
The Morningstar Rating for Funds, or “star rating,” is calculated for managed products with at least a three-year history. Exchange-traded funds and open-ended mutual funds are considered a single population for comparative purposes. It is calculated based on a Morningstar Risk-Adjusted Return measure that accounts for variation in a managed product’s monthly excess performance, placing more emphasis on downward variations and rewarding consistent performance.
The top 10% of products in each product category receive five stars, the next 22.5% receive four stars, the next 35% receive three stars, the next 22.5% receive two stars, and the bottom 10% receive one star. The Overall Morningstar Rating for a managed product is derived from a weighted average of the performance figures associated with its three- and five-year Morningstar Rating metrics. The weights are: 100% three-year rating for 36–59 months of total returns and 60% five-year rating/40% three-year rating for 60–119 months of total returns.
4 Sources: WisdomTree, FactSet, Russell, as of 1/31/24. U.S. small caps measured by the Russell 2000 Index.
Important Risks Related to this Article
There are risks associated with investing, including the possible loss of principal. Foreign investing involves special risks, such as risk of loss from currency fluctuation or political or economic uncertainty. Funds focusing on a single sector and/or smaller companies generally experience greater price volatility. Investments in emerging, offshore or frontier markets are generally less liquid and less efficient than investments in developed markets and are subject to additional risks, such as risks of adverse governmental regulation, intervention and political developments. Due to the investment strategy of this Fund, it may make higher capital gain distributions than other ETFs. Dividends are not guaranteed, and a company currently paying dividends may cease paying dividends at any time. Please read the Fund’s prospectus for specific details regarding the Fund’s risk profile.
Morningstar percentile rankings are based on a fund’s average annual total return relative to all funds in the same Morningstar category, which includes both mutual funds and ETFs and does not include the effect of sales charges. Fund performance used within the ranking reflects certain fee waivers, without which returns and Morningstar rankings would have been lower. The highest (or most favorable) percentile rank is 1, and the lowest (or least favorable) percentile rank is 100. Past performance does not guarantee future results.
Morningstar, Inc. All Rights Reserved. The information herein: (1) is proprietary to Morningstar and/or its content providers; (2) may not be copied or distributed; and (3) is not warranted to be accurate, complete or timely. Neither Morningstar nor its content providers are responsible for any damages or losses arising from any use of this information.
Copyright © WisdomTree


