


by John Lynch, CIO, & Team, Comerica Wealth Management
The Federal Reserve meets this week with recent inflationary headwinds. Market interest rates have nudged higher and equity indexes appear to be running into resistance.
Executive Summary
Recent pricing data was stronger than expected, likely extending the Fed’s “higher for longer” stance.
- While all the focus has been on stock market records, the U.S. Treasury Yield Curve also celebrated a milestone this past week. At 425 trading days and counting, the yield curve has been inverted for the longest period in its ~50-year history.
- The U.S. 10-year Treasury yield is now hovering at the upper end of the range (3.80% to 4.30%) it has occupied over the past six months.
- The strong rally off the October lows is running into resistance of late, with the S&P 500® Index finishing down for the second consecutive week.
While a pause is plausible in the equity markets, it would be consistent with seasonal weakness typical in presidential election years and is something to be prepared for as investors can use weakness to rebalance portfolios back toward targeted longer-term allocations.
Inflation and the Fed
Recent pricing data was stronger than expected, likely extending the Fed’s “higher for longer” stance.
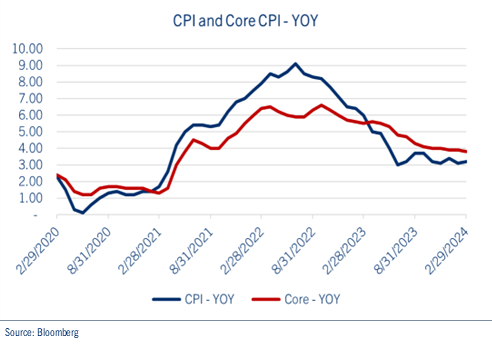
Indeed, the Consumer Price Index (CPI) print topped estimates in February for the second consecutive month, as reduced shelter prices were offset by increases in the costs for used cars, clothing and air travel. The core CPI, which excludes volatile food and energy prices, increased 0.4% in February and is now up 3.8% year-over-year (YOY). It should be noted that Core CPI has been trending higher recently, increasing at an annualized rate of 4.2% over the last three months, the fastest pace since June. See chart: CPI and Core CPI - YOY.
Wholesale prices also came in above expectations last month, as the Producers Price Index (PPI) climbed 0.6% from January’s level and coming in twice the consensus estimate of 0.3%.
The latest pricing data provides further evidence of stalling disinflation, giving monetary policymakers more reasons to hold off on cutting interest rates. Investors will look for some clarity from Fed Chair Jerome Powell at this week’s FOMC meeting relative to the timing and magnitude of policy easing.
We continue to look for three rate cuts, beginning in June, which should also coincide with the Fed’s plans to begin moderating the pace at which maturing Treasury and mortgage securities roll off its balance sheet (quantitative tightening).
Fed Funds Futures markets responded by further slashing the number of cuts priced-in this year. The implied Fed Funds rate for the end of the year sits above 4.5%, the highest it has been since November. This suggests consensus expectations have declined from six cuts in 2024 to a range of three-four cuts, instead.
U.S. Treasury Yield Curve
While all the focus has been on stock market records, the U.S. Treasury Yield Curve also celebrated a milestone this past week. See chart: U.S. Treasury Yield Curve.
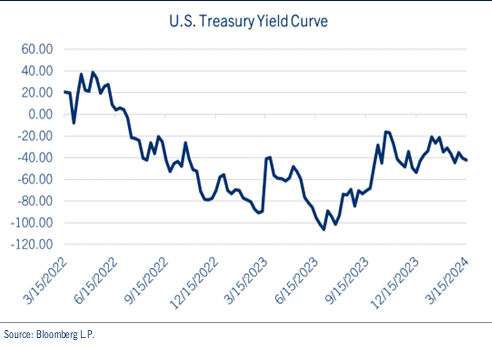
At 425 trading days and counting, the yield curve has been inverted for the longest period in its ~50-year history. Moreover, the spread between the 2-year Treasury bill and the 10-year Treasury note has accomplished this feat without triggering recession. Typically, it stands to reason that if financing costs over the near term are greater than those over the longer term, enough activity would be delayed resulting in negative output growth.
However, this cycle is not typical. Employment has remained solid and the money supply, as defined by M2, is up ~30.0% to $20.5 trillion since the fourth quarter of 2019, providing ballast to consumers and businesses, many of whom were desensitized to tighter Fed policy, having secured long-term funding at lower rates over the prior several years.
In addition, the U.S. 10-year Treasury yield is now hovering at the upper end of the range (3.80% to 4.30%) it has occupied over the past six months or so. It should be noted that this trend contrasts with global yields, which are decidedly lower. A break higher in the U.S. benchmark may provide pressure to the recent strength in both the economy and stock prices.
Equities
The strong rally off the October lows is running into resistance of late, with the S&P 500® Index finishing down for the second consecutive week. See chart: S&P 500® Index.
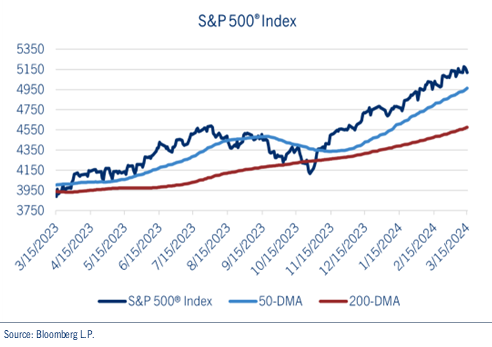
Of course, a better than expected fourth quarter earnings season is wrapping up and investors are searching for another catalyst for the next move higher. Inflation pressures persist and market interest rates have nudged higher as consensus expectations for the next Fed rate cut keep getting pushed out.
We have been pleased that participation in the equity market has broadened out, with the equally weighted S&P 500® beginning to catch up with its more popular cap-weighted Index, though it still trails by approximately 300 basis points year-to-date.
As several names in the Magnificent Seven struggle, the S&P 500® Index is exhibiting signs of a near-term top as momentum begins to moderate. Indeed, negative divergences are evident with the Index hovering near its highs while momentum, as measured by the 14-day Relative Strength Index (RSI), has broken lower. A break below the February 5,050 level could bring the 50-DMA of ~4,950 into play, followed by the December 2021 – January 2022 high of 4,820. Considering good earnings prospects, copper’s recent breakout, declining global yields, a U.S. dollar that appears to have topped, and full employment, we suspect any pullback would be in the -5.0% to -6.0% range.
While a pause is plausible in the equity markets, it would be consistent with seasonal weakness typical in presidential election years and is something to be prepared for as investors can use weakness to rebalance portfolios back toward targeted longer-term allocations.
Be well and stay safe!
Contributors
John Lynch
Chief Investment Officer
Comerica Wealth Management
Deborah Koplik
Director Portfolio Management
Comerica Wealth Management
Matthew Anderson
Senior Analyst
Comerica Wealth Management
*****
IMPORTANT DISCLOSURES
Comerica Wealth Management consists of various divisions and affiliates of Comerica Bank, including Comerica Bank & Trust, N.A. Inc. and Comerica Insurance Services, Inc. and its affiliated insurance agencies.
Comerica Bank and its affiliates do not provide tax or legal advice. Please consult with your tax and legal advisors regarding your specific situation.
Non-deposit Investment products offered by Comerica and its affiliates are not insured by the FDIC, are not deposits or other obligations of or guaranteed by Comerica Bank or any of its affiliates, and are subject to investment risks, including possible loss of the principal invested.
Unless otherwise noted, all statistics herein obtained from Bloomberg L.P.
This is not a complete analysis of every material fact regarding any company, industry or security. The information and materials herein have been obtained from sources we consider to be reliable, but Comerica Wealth Management does not warrant, or guarantee, its completeness or accuracy. Materials prepared by Comerica Wealth Management personnel are based on public information. Facts and views presented in this material have not been reviewed by, and may not reflect information known to, professionals in other business areas of Comerica Wealth Management, including investment banking personnel.
The views expressed are those of the author at the time of writing and are subject to change without notice. We do not assume any liability for losses that may result from the reliance by any person upon any such information or opinions. This material has been distributed for general educational/informational purposes only and should not be considered as investment advice or a recommendation for any particular security, strategy or investment product, or as personalized investment advice.
Diversification does not ensure a profit or protect against a loss in a declining market. Past performance is no guarantee of future returns. The performance of an index is not an exact representation of any particular investment, as you cannot invest directly in an index. The material is not intended as an offer or solicitation for the purchase or sale of any financial instrument. The investments and strategies discussed herein may not be suitable for all clients.
The S&P 500® Index, S&P MidCap 400 Index®, S&P SmallCap 600 Index® and Dow Jones Wilshire 500® (collectively, “S&P® Indices”) are products of S&P Dow Jones Indices, LLC or its affiliates (“SPDJI”) and Standard & Poor’s Financial Services, LLC and has been licensed for use by Comerica Bank, on behalf of itself and its Affiliates. Standard & Poor’s® and S&P® are registered trademarks of Standard & Poor’s Financial Services, LLC (“S&P”) and Dow Jones® is a registered trademark of Dow Jones Trademark Holdings, LLC (“Dow Jones”). The S&P 500®® Index Composite is not sponsored, endorsed, sold or promoted by SPDJI, Dow Jones, S&P, or their respective affiliates and none of such parties make any representation regarding the advisability of investing in such product nor do they have any liability for any errors, omissions, or interruptions of the S&P Indices.
NEITHER S&P DOW JONES INDICES NOR STANDARD & POOR’S FINANCIAL SERVICES, LLC GUARANTEES THE ADEQUACY, ACCURACY, TIMELINESS AND/OR THE COMPLETENESS OF THE WAM STRATEGIES OR ANY DATA RELATED THERETO OR ANY COMMUNICATION, INCLUDING BUT NOT LIMITED TO, ORAL OR WRITTEN COMMUNCATION (INCLUDING ELECTRONIC COMMUNICATIONS) WITH RESPECT THERETO. S&P DOW JONES INDICES AND STANDARD & POOR’S FINANCIAL SERVICES, LLC SHALL NOT BE SUBJECT TO ANY DAMAGES OR LIABILITY FOR ANY ERRORS, OMISSIONS, OR DELAYS THEREIN. S&P DOW JONES INDICES AND STANDARD & POOR’S FINANCIAL SERVICES, LLC MAKE NO EXPRESS OR IMPLIED WARRANTIES, AND EXPRESSLY DISCLAIM ALL WARRANTIES, OR MERCHANTABILITY OR FITNESS FOR A PARTICULAR PURPOSE OR USE OR AS TO RESULTS TO BE OBTAINED BY COMERICA AND ITS AFFILIATES, OR ANY OTHER PERSON OR ENTITY FROM THE USE OF THE S&P INDICES OR WITH RESPECT TO ANY DATA RELATED THERETO. WITHOUT LIMITING ANY OF THE FOREGOING, IN NO EVENT WHATSOEVER SHALL S&P DOW JONES INDICES OR STANDARD & POOR’S FINANCIAL SERVICES, LLC BE LIABLE FOR ANY INDIRECT, SPECIAL, INCIDENTAL, PUNITIVE, OR CONSEQUENTIAL DAMAGES INCLUDING BUT NOT LIMITED TO, LOSS OF PROFITS, TRADING LOSSES, LOST TIME OR GOODWILL, EVEN IF THEY HAVE BEEN ADVISED OF THE POSSIBILITY OF SUCH DAMAGES, WHETHER IN CONTRACT, TORT, STRICT LIABILITY, OR OTHERWISE. THERE ARE NO THIRD-PARTY BENEFICIARIES OF ANY AGREEMENTS OR ARRANGEMENTS BETWEEN S&P DOW JONES INDICES AND COMERICA AND ITS AFFILIATES, OTHER THAN THE LICENSORS OF S&P DOW JONES INDICES.
“Russell 2000® Index and Russell 3000® Index” are trademarks of Russell Investments, licensed for use by Comerica Bank. The source of all returns is Russell Investments. Further redistribution of information is strictly prohibited.
MSCI EAFE® is a trademark of Morgan Stanley Capital International, Inc. (“MSCI”). Source: MSCI. MSCI makes no express or implied warranties or representations and shall have no liability whatsoever with respect to any MSCI data contained herein. The MSCI data may not be further redistributed or used as a basis for other indexes or any securities or financial products. This report is not approved, endorsed, reviewed or produced by MSCI. None of the MSCI data is intended to constitute investment advice or a recommendation to make (or refrain from making) any kind of investment decision and may not be relied on as such.
FTSE International Limited (“FTSE”) © FTSE 2016. FTSE® is a trademark of London Stock Exchange Plc and The Financial Times Limited and is used by FTSE under license. All rights in the FTSE Indices vest in FTSE and/or its licensors. Neither FTSE nor its licensors accept any liability for any errors or omissions in the FTSE Indices or underlying data.comerica.com/insights
Copyright © Comerica Wealth Management