
Pre-opening Comments for Monday August 14th
U.S. equity index futures were lower this morning. S&P 500 futures were down 6 points in pre-opening trade.
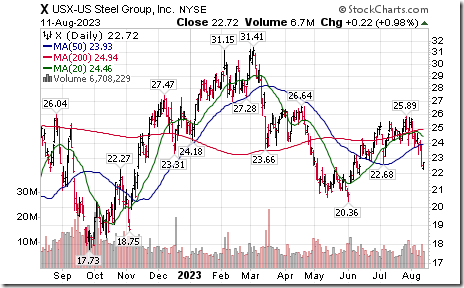
US Steel gained $0.22 to $22.72 after the company confirmed receipt of multiple unsolicited proposals to acquire some or all of the company.
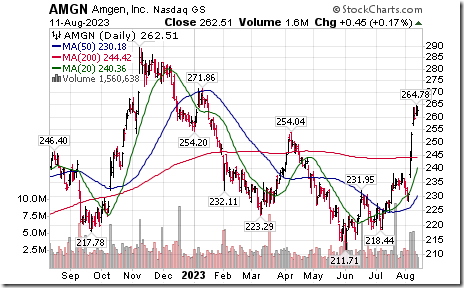
Amgen gained $0.96 to $263.47 after Mizuho raised its target price from $214 to $223.
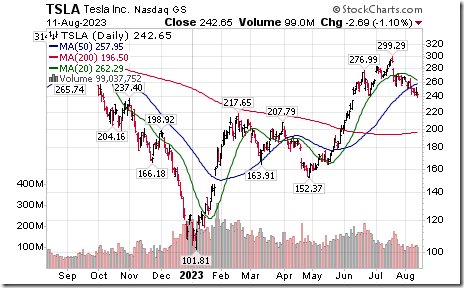
Tesla dropped $4.95 to $237.70 after reducing the price of its autos in China.
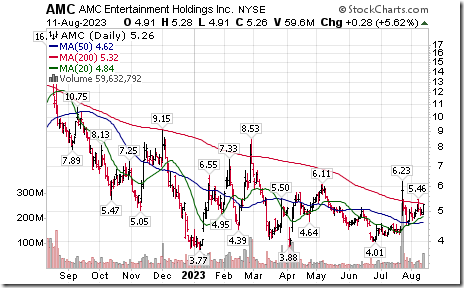
AMC plunged $1.47 to $3.79 after the company received court approval for a revised stock conversion plan.
EquityClock’s Daily Comment
Headline reads “Treasury yield spreads are showing indications that they have bottomed and the path towards normalization may be underway”.
http://www.equityclock.com/2023/08/12/stock-market-outlook-for-august-14-2023/
The Bottom Line
Now is the time for intermediate swing traders to become patient
Led by the “Magnificent Seven” big cap technology stocks, U.S. equity indices came under short term trading profit taking pressures last week. Intermediate term and long term momentum data available at the end of this report shows that the S&P 500 Index is overbought and has started to trend down.
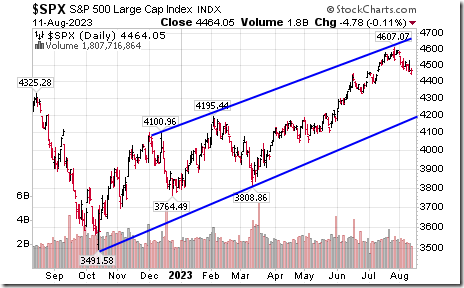
Carter Worth from CNBC noted the following:
· Intermediate trend for the S&P 500 is up and within a well-defined channel.
· The Index has started to retreat from the top of its channel
· Downside risk within the channel is to 4,200 implying short term downside potential of another 6%.
· The Index recently has entered into a short term corrective phase within an intermediate uptrend. Weakness by the Index to near the 4,200 level during the typically volatile late July/mid- September period will provide an opportunity to buy favoured U.S. indices, equities and ETFs on short term weakness.
Economic News This Week
Source: www.investing.com
August Empire State Manufacturing Survey is released at 8:30 AM EDT on Tuesday July survey was reported at 1.10.
July U.S. Retail Sales released at 8:30 AM EDT on Tuesday are expected to increase 0.4% versus a gain of 0.2% in June.
July Canadian Consumer Price Index released at 8:30 AM EDT on Tuesday
on a year-over-year basis is expected to increase 2.7% versus a gain of 2.8% in June.
June Business Inventory released at 10:00 AM EDT on Tuesday are expected to increase 0.1% versus a gain of 0.2% in May.
July U.S. Housing Starts released at 8:30 AM EDT on Wednesday are expected to increase to 1.440 million units from 1.434 million units in June.
July U.S. Capacity Utilization released at 9:15 AM EDT on Wednesday is expected to increase to 79.2% from 78.9% in June. July U.S. Industrial Production is expected to increase 0.3% versus a decline of 0.5% in June.
FOMC Meeting Minutes are released at 2:00 PM EDT on Wednesday.
August Philly Fed Index released at 8:30 AM EDT on Thursday is expected to increase from -13.5 to -10.0.
July Leading Economic Indicators are released at 10:00 AM EDT on Thursday. They dropped 0.7% in June.
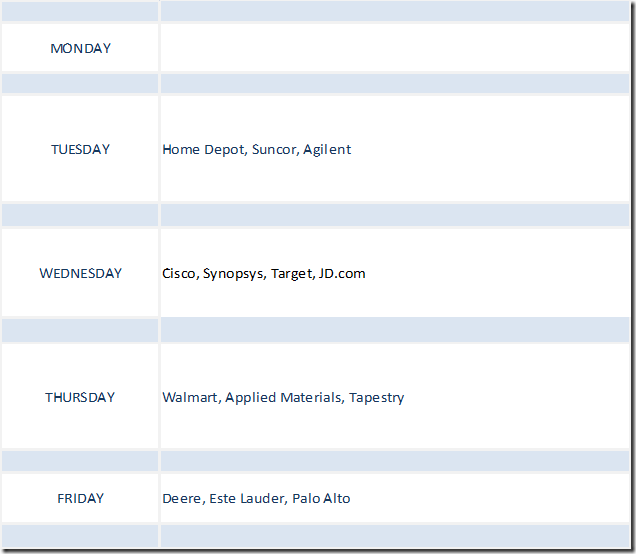
Selected Earnings News This Week
Source: www.investing.com
Focus is on retail stocks: Home Depot, Target, Walmart
Trader’s Corner
Equity Indices and Related ETFs
Daily Seasonal/Technical Equity Trends for August 11th 2023
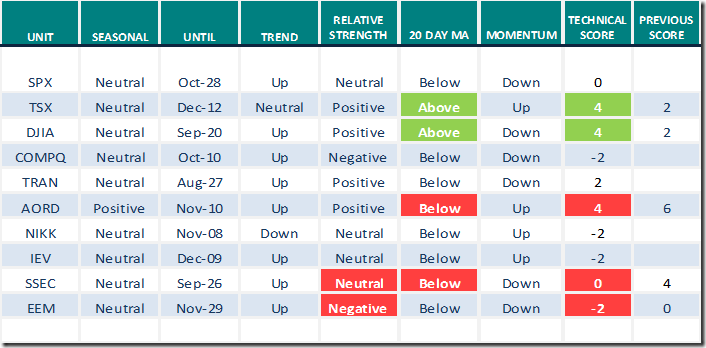
Green: Increase from previous day
Red: Decrease from previous day
Source for all positive seasonality ratings: www.EquityClock.com
Commodities
Daily Seasonal/Technical Commodities Trends for August 11th 2023
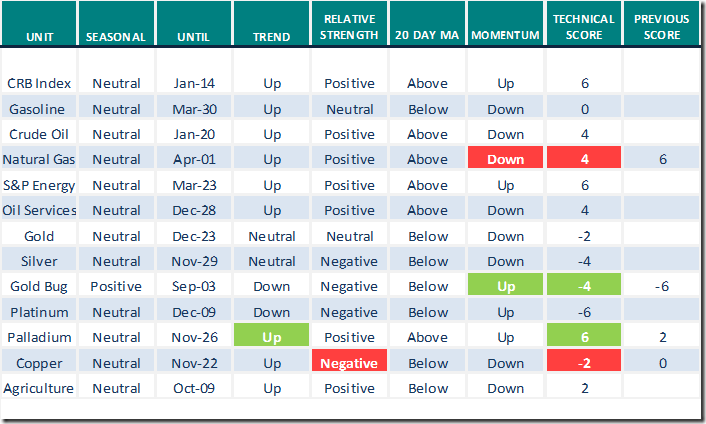
Green: Increase from previous day
Red: Decrease from previous day
Sectors
Daily Seasonal/Technical Sector Trends for August 11th 2023
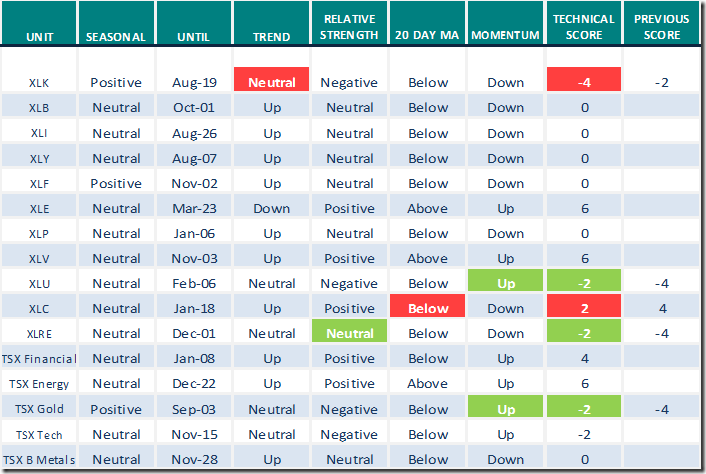
Green: Increase from previous day
Red: Decrease from previous day
Links offered by valued providers
Mike’s Money Talks for August 12th
Michael Campbell’s MoneyTalks – Complete Show (mikesmoneytalks.ca)
Growing Urgency to Modernize U.S. Power Grid: Got Copper? Sprott Research
Sprott Energy Transition Materials Monthly: Growing Urgency to Modernize U.S. Power Grid
Russell 2000 Small-Caps Bullish Seasonality Coming Up | Your Daily Five (08.09.23)
Russell 2000 Small-Caps Bullish Seasonality Coming Up | Your Daily Five (08.09.23) – YouTube
Stocks Take a Break For That 7th Inning Stretch! | GoNoGo Charts (08.10.23)
Stocks Take a Break For That 7th Inning Stretch! | GoNoGo Charts (08.10.23) – YouTube
The Great Rotation of 2023 Continues: Latest Updates and Insights | The Final Bar (08.11.23)
https://www.youtube.com/watch?v=3BDgnVeZPNI
Patience is Key: Waiting for the Pull Back to Run Its Course | Moxie Indicator Minutes (08.11.23)
Charts Point To Stock Market Breakdown
Carter Worth calls for a potential 9% correction in a bull market.
Charts Point To Stock Market Breakdown – YouTube
Check Out These Bright Spots In A Weak Market! | The MEM Edge (08.11.23)
https://www.youtube.com/watch?v=Tx9EvLreN3Q
Comments by Mark Liebovit
This Week in Money – HoweStreet
Technical Scoop from David Chapman and www.enrichedinvesting.com
Technical Scores
Calculated as follows:
Intermediate Uptrend based on at least 20 trading days: Score 2
(Higher highs and higher lows)
Intermediate Neutral trend: Score 0
(Not up or down)
Intermediate Downtrend: Score -2
(Lower highs and lower lows)
Outperformance relative to the S&P 500 Index: Score: 2
Neutral Performance relative to the S&P 500 Index: 0
Underperformance relative to the S&P 500 Index: Score –2
Above 20 day moving average: Score 1
At 20 day moving average: Score: 0
Below 20 day moving average: –1
Up trending momentum indicators (Daily Stochastics, RSI and MACD): 1
Mixed momentum indicators: 0
Down trending momentum indicators: –1
Technical scores range from -6 to +6. Technical buy signals based on the above guidelines start when a security advances to at least 0.0, but preferably 2.0 or higher. Technical sell/short signals start when a security descends to 0, but preferably -2.0 or lower.
Long positions require maintaining a technical score of -2.0 or higher. Conversely, a short position requires maintaining a technical score of +2.0 or lower
Changes Last Week
Technical Notes for Friday
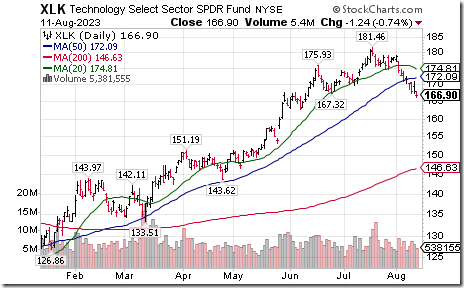
Technology SPDRs $XLK moved below intermediate support at $167.32.
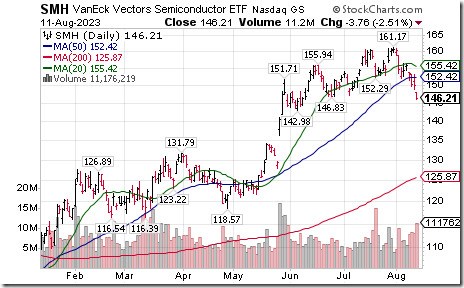
Semiconductor ETF $SMH moved below intermediate support at $146.83.
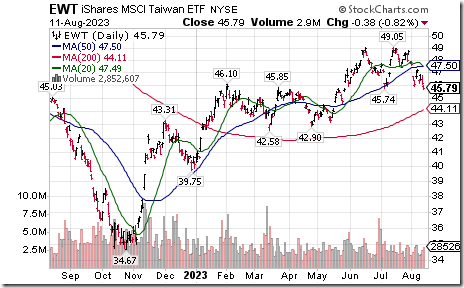
Taiwan iShares $EWT moved below $45.74 completing a double top pattern.
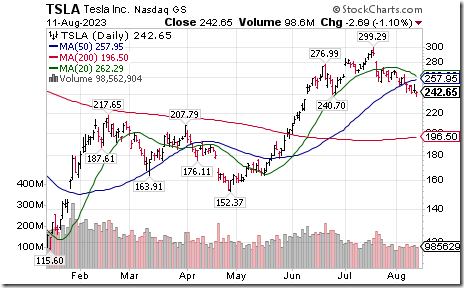
Tesla $TSLA a NASDAQ 100 stock moved below intermediate support at $240.70.
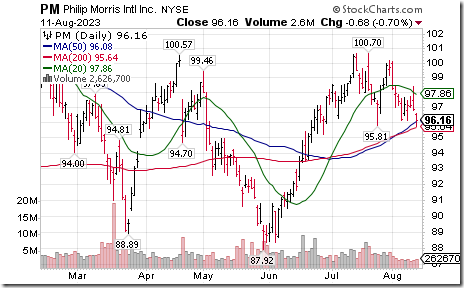
Phillip Morris International $PM an S&P 100 stock moved below $95.81 setting an intermediate downtrend.
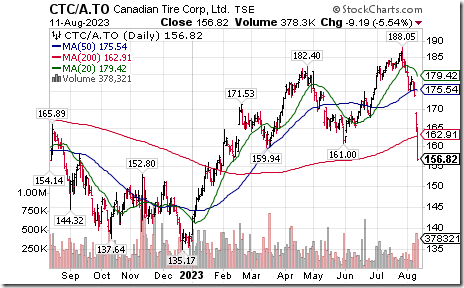
Canadian Tire $CTC.A.TO a TSX 60 stock moved below intermediate support at $161.00 and $159.94 following release of less than consensus second quarter results.
S&P 500 Momentum Barometers
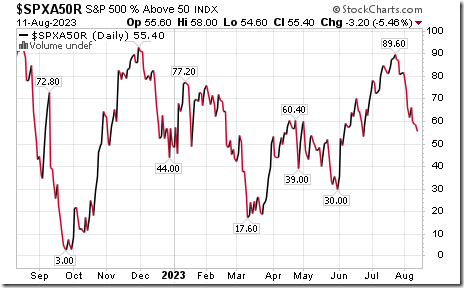
The intermediate term Barometer dropped 3.20 on Friday and plunged 6.40 last week to 55.40. It changed from Overbought to Neutral on a drop below 60.00. Daily trend is down.
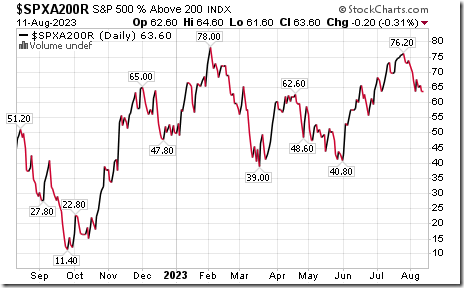
The long term Barometer slipped 0.20 on Friday and was unchanged last week at 63.60. It remains Overbought. Daily trend is down.
TSX Momentum Barometers
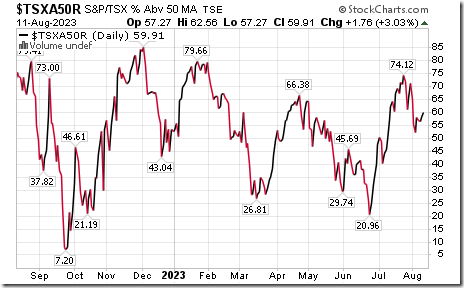
The intermediate term Barometer added 1.76 on Friday and gained 1.76 last week to 59.91. It remains Neutral.
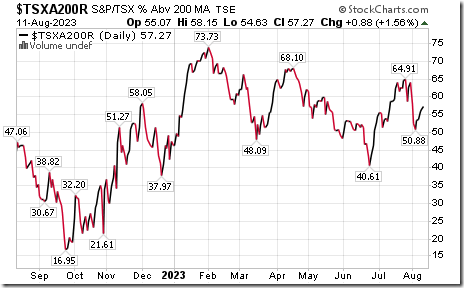
The long term Barometer added 0.88 on Friday and gained 3.97 last week to 57.27. It remains Neutral.
Disclaimer: Seasonality ratings and technical ratings offered in this report and at
www.equityclock.com are for information only. They should not be considered as advice to purchase or to sell mentioned securities. Data offered in this report is believed to be accurate, but is not guaranteed