
by Raffaele Savi, Head of Systematic Investing & Co-Head of Systematic Active Equity, & Jeff Shen, PhD, Co-Head of Systematic Active Equity, BlackRock
Key points
- What's priced in? Strong equity returns in recent months reflect a shift in market focus towards the AI theme, earnings, and growth potential over the inflation and rates narrative. Market pricing is currently most aligned with a soft-landing economic scenario.
- Less inflation frustration ahead? Alternative data indicators show signs of continued progress in core inflation normalizing. Some economic activity measures have started to cool, but key recession signposts like broad-based layoffs haven’t arrived.
- Equity market opportunities: We see room to run for the AI theme but are focused on taking a more selective approach to identifying winners in the space. As market breadth improves, we are positioned to take advantage of a broader equity opportunity set.
Equity returns have defied expectations the first half of 2023. Despite a backdrop of banking stress, rising recession risk, and materially tighter monetary policy than expected at the outset of the year, equities have continued to march higher.
The relatively narrow shape of the market rally, along with continued macro uncertainty, has raised key questions for investors. Do equity markets and the artificial intelligence (“AI”) theme that’s driven the bulk of year-to-date gains still have room to run? Can the US economy continue to avoid a recession? Or is the soft-landing scenario priced into equity markets too good to be true? In this quarter’s Systematic Equity Outlook, we use alternative data insights to answer these questions and what they may mean for markets and portfolios in the months ahead.
What’s priced in?
Economic forecasters have largely expected a US recession to materialize by now. After 500 basis points of rate increases, some signs of economic weakness have surfaced, but the long-awaited recession still hasn’t arrived. Now, the US Federal Reserve (“Fed”) has signaled that they expect a higher terminal rate will be needed to fully restore price stability. What does this mean for the likelihood of a US recession as we look ahead? In Figure 1, we outline a range of potential economic outcomes that coincide with representative portfolios that we’ve constructed based on historical regime analysis.

To understand what’s priced into equity markets, we use the portfolio returns to determine the market-implied probability of each outcome. Figure 2 shows that while there is a marginal buyer for each outcome, the soft-landing scenario has gained the most traction in recent months. This reflects market momentum that’s been largely focused on opportunities related to the AI theme, earnings, and growth potential rather than the inflation and rates narrative.

In our last outlook, we discussed the significantly higher probability of a recession implied by bond markets as the yield curve remains deeply inverted. Historically, in periods where the implied recession probability of bonds has exceeded equities by the current magnitude, bond markets have been correct in predicting a recession. This pricing mismatch has persisted throughout 2023, yet equity markets have remained resilient. So is there still a path to avoiding a recession if the macroeconomic backdrop improves?
Less inflation frustration ahead?
The Fed has maintained a stubbornly hawkish stance and now expects that additional tightening will be needed to rein in inflation. However, our alternative data indicators suggest that inflation may normalize faster than many policymakers expect. This forecast was realized in June CPI data which came in below expectations, and we expect to see continued progress ahead.
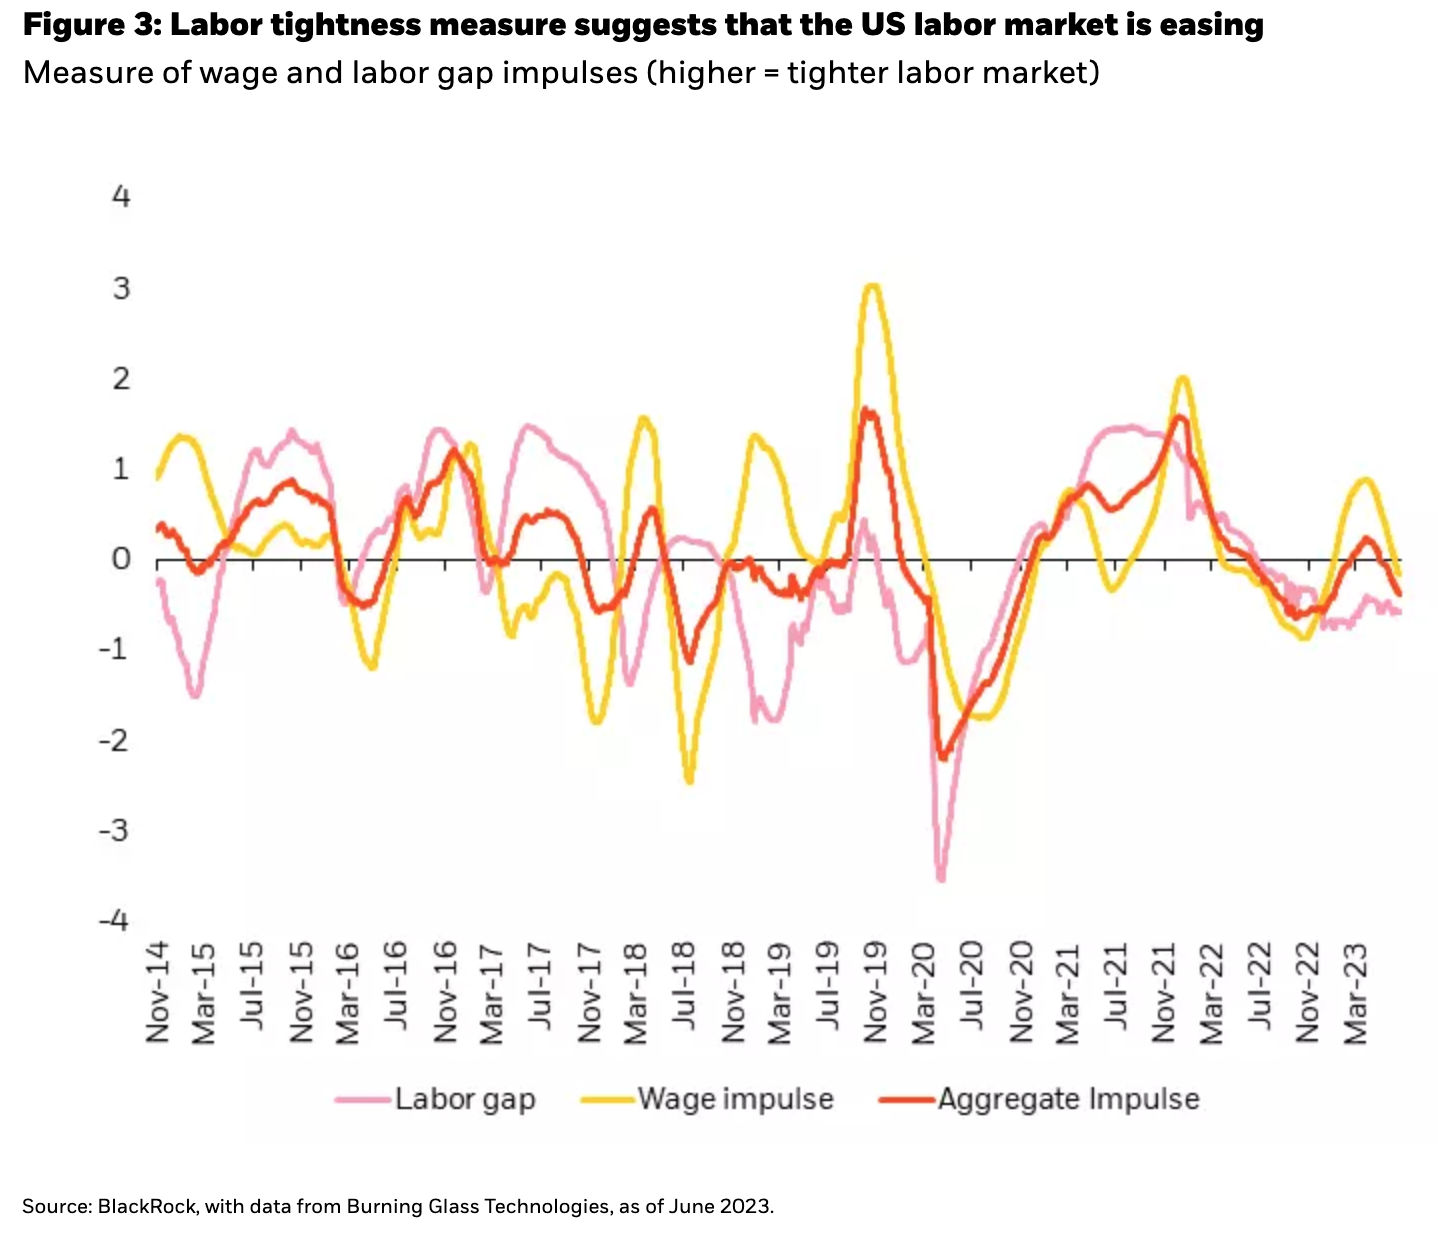
Core services ex-housing inflation has remained a key focus area for the Fed. Persistent strength has been underpinned by wage growth and tight labor markets, largely due to post-pandemic labor shortages. Figure 3 shows our measure of US labor market tightness. This measure analyzes the gap between labor demand from online job postings and labor supply from online hiring searches. It also factors in the pace of wage growth from online job postings. The aggregate measure (orange line) has fallen below zero, signaling that labor market tightness is easing as supply and demand continues to rebalance. We expect this trend to relieve pressure from core services ex-housing inflation as we look ahead.
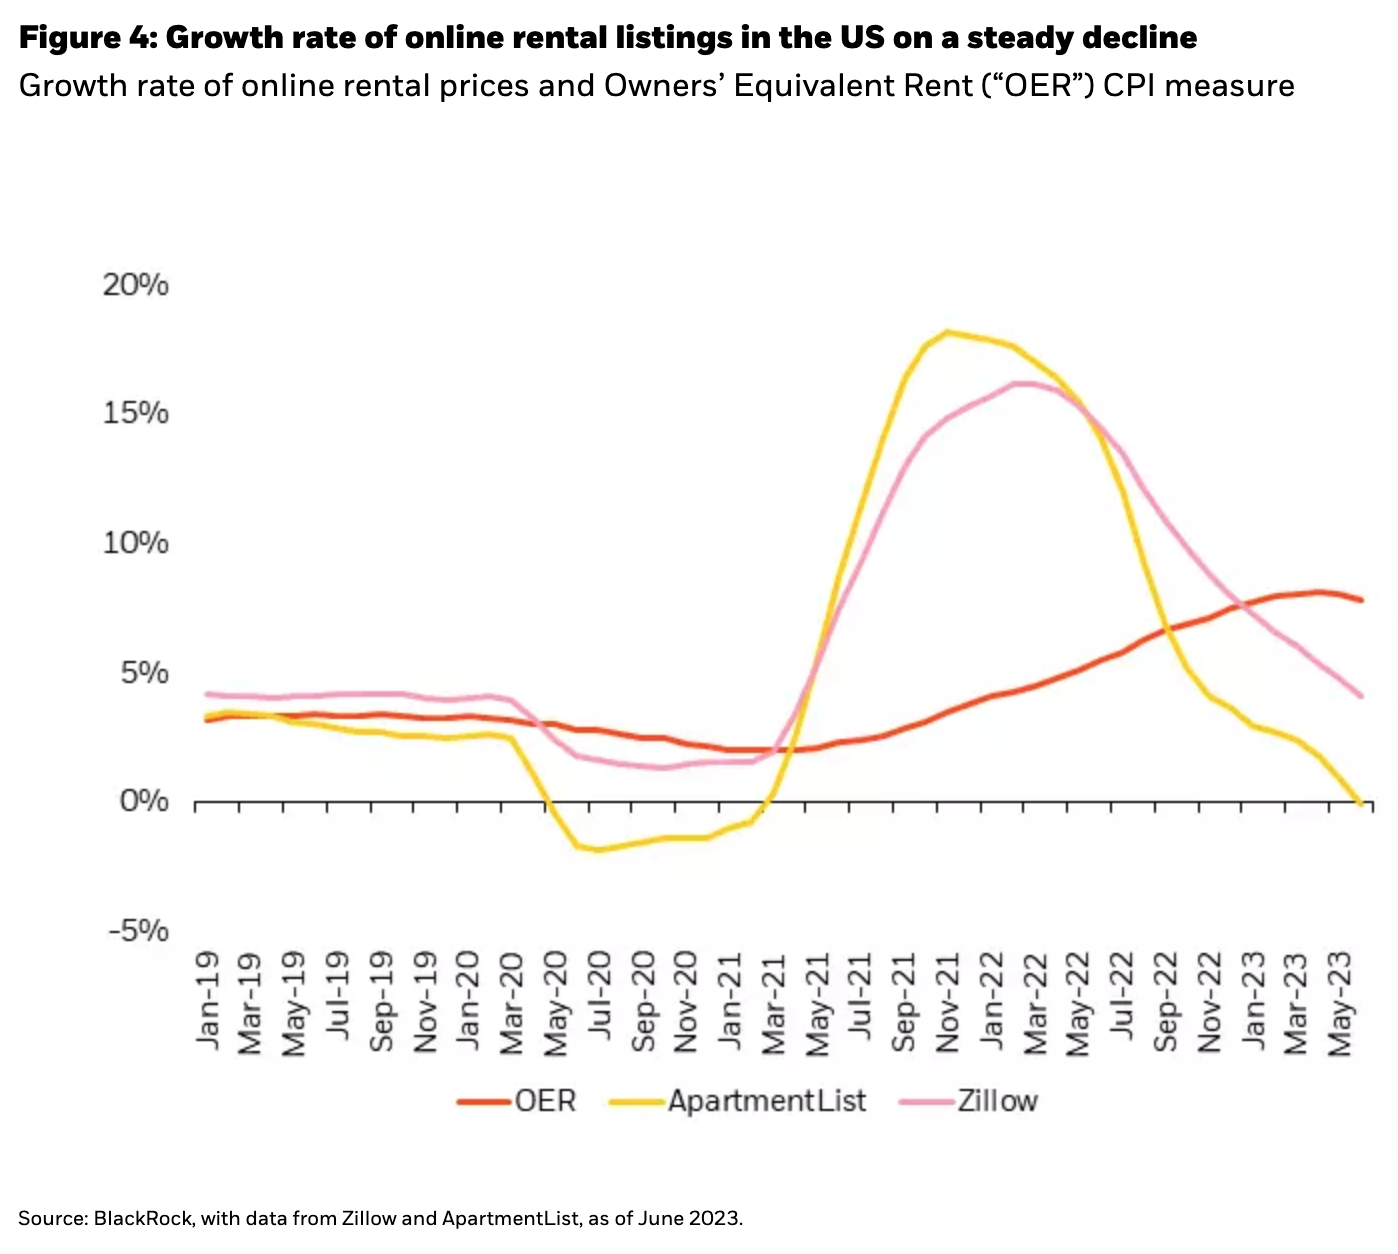
Another disinflationary trend we see is in shelter. Shelter makes up a large portion of core inflation and is mostly comprised of rental data. The yellow and pink lines in Figure 4 represent the year-over-year growth of online rental listings in the US which has been falling since early 2022. We use this data to forecast the Owners’ Equivalent Rent (“OER”) component of US CPI. Based on our leading indicators, OER appears to have peaked and is likely to continue declining in the coming months.
These measures, along with signs of renewed progress in core goods inflation, are a few examples of the inputs that have been shaping our view that inflation may normalize more rapidly than the Fed expects. If that proves correct, it would reduce pressure on rates to stay as high as they are or increase—a positive for equity markets overall.
Mixed signals on economic growth… but getting better
Economic growth has held up better than expected through the first half of 2023 given the level of tightening that’s taken place. While some activity measures have started to cool, they’re coming down from unusually high levels fueled by strong wage gains and deep savings wells that are unique to the post-pandemic economy. This raises the possibility that recession probability models based on historical data and traditional signposts (like the yield curve), may be overstating the likelihood of a near-term recession.
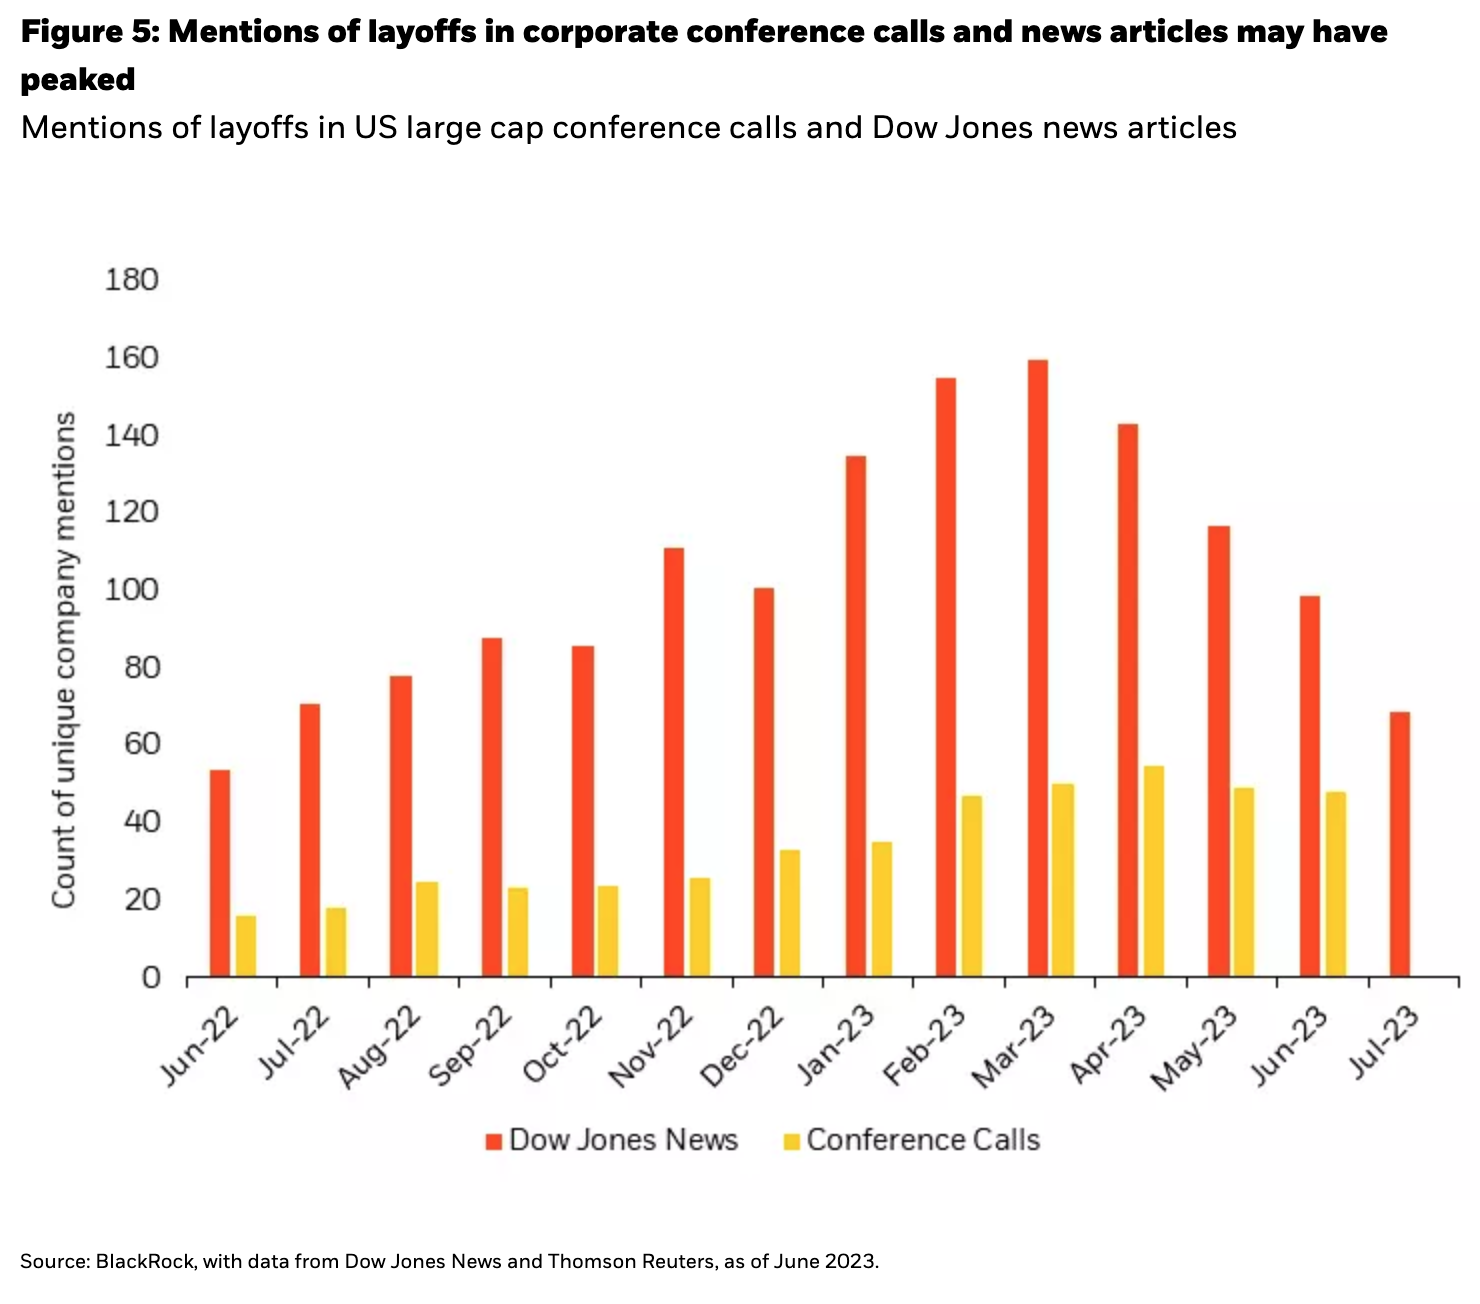
Broad-based layoffs are a key recession signpost that still hasn’t shown up in the US. Figure 5 illustrates a declining number of unique mentions of layoffs in conference calls and news articles. Layoff mentions peaked around late March to early April and have been falling since. This is also consistent with our online job postings data, where declines in the volume of job postings are responsible for a large portion of the labor demand normalization that we’ve seen so far (rather than widespread job losses).
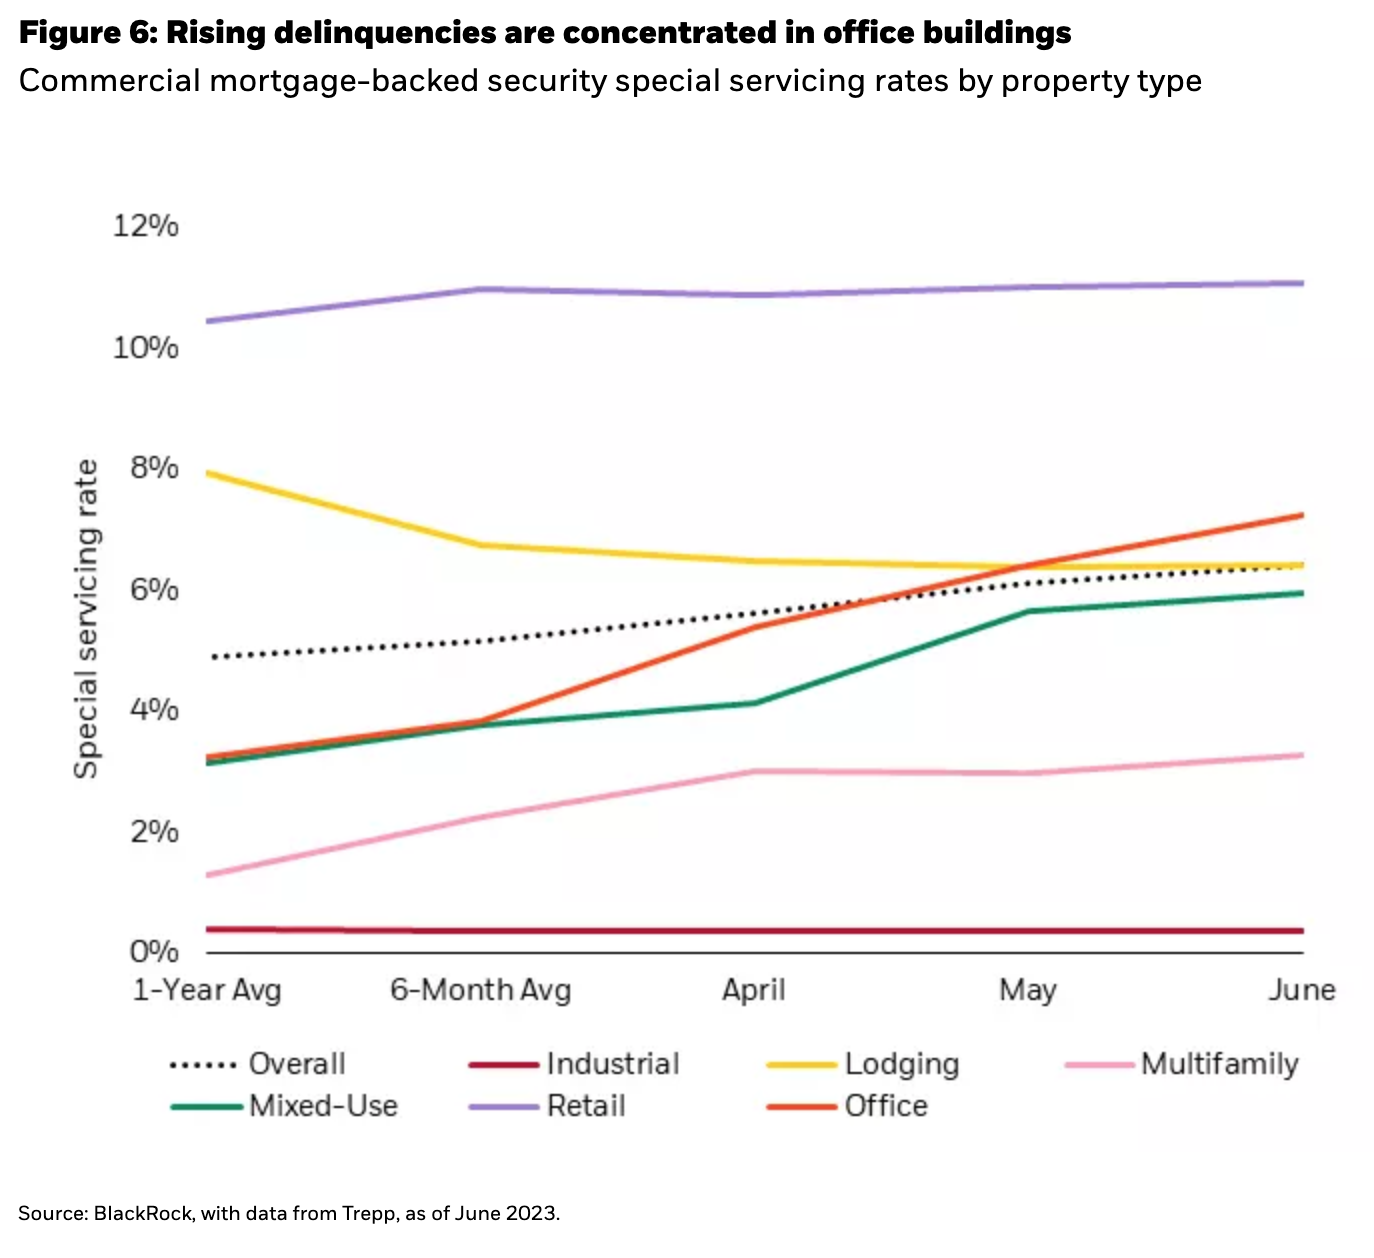
While the US economy has been less responsive to rate increases than anticipated, there are certain segments where we see risks bubbling up. Commercial real estate is one segment that has faced material headwinds since the pandemic. Improvements in office occupancy have stalled this year as hybrid work continues to dominate—causing a spike in US office delinquencies. When borrowers default on their loan, the loan is serviced by a third-party firm known as a special servicer. Figure 6 shows the recent rise in special servicing rates that’s largely specific to office buildings. Importantly, we believe the current weakness will be exacerbated by refinancing risks as more loans come due. If rates stay high and revenues remain stretched, office REITS may face the dual pressures of falling revenues and rising costs.
All eyes on AI
Equity market gains in 2023 have been largely driven by the AI theme. Increased investor interest in AI has coincided with notable outperformance of the largest US technology stocks. The magnitude and narrow breadth of the rally has raised questions as to whether there’s more room to run for equities, or if we’re facing a repeat of the dot-com bubble. We see a few key reasons to remain positive on the AI theme and equities more broadly.
Not Dotcom 2.0
Technology today is different from late-1990s technology. Fundamental indicators like profitability and cash flow generation point to a much stronger backdrop today than leading up to the bursting of the dot-com bubble.
AI is not necessarily a speculative long duration play. Some of the leading players are already starting to monetize the opportunity and seeing upward revisions to near-term earnings estimates. This is keeping technology valuations at levels which, while elevated, are still comparable to those observed in recent history.
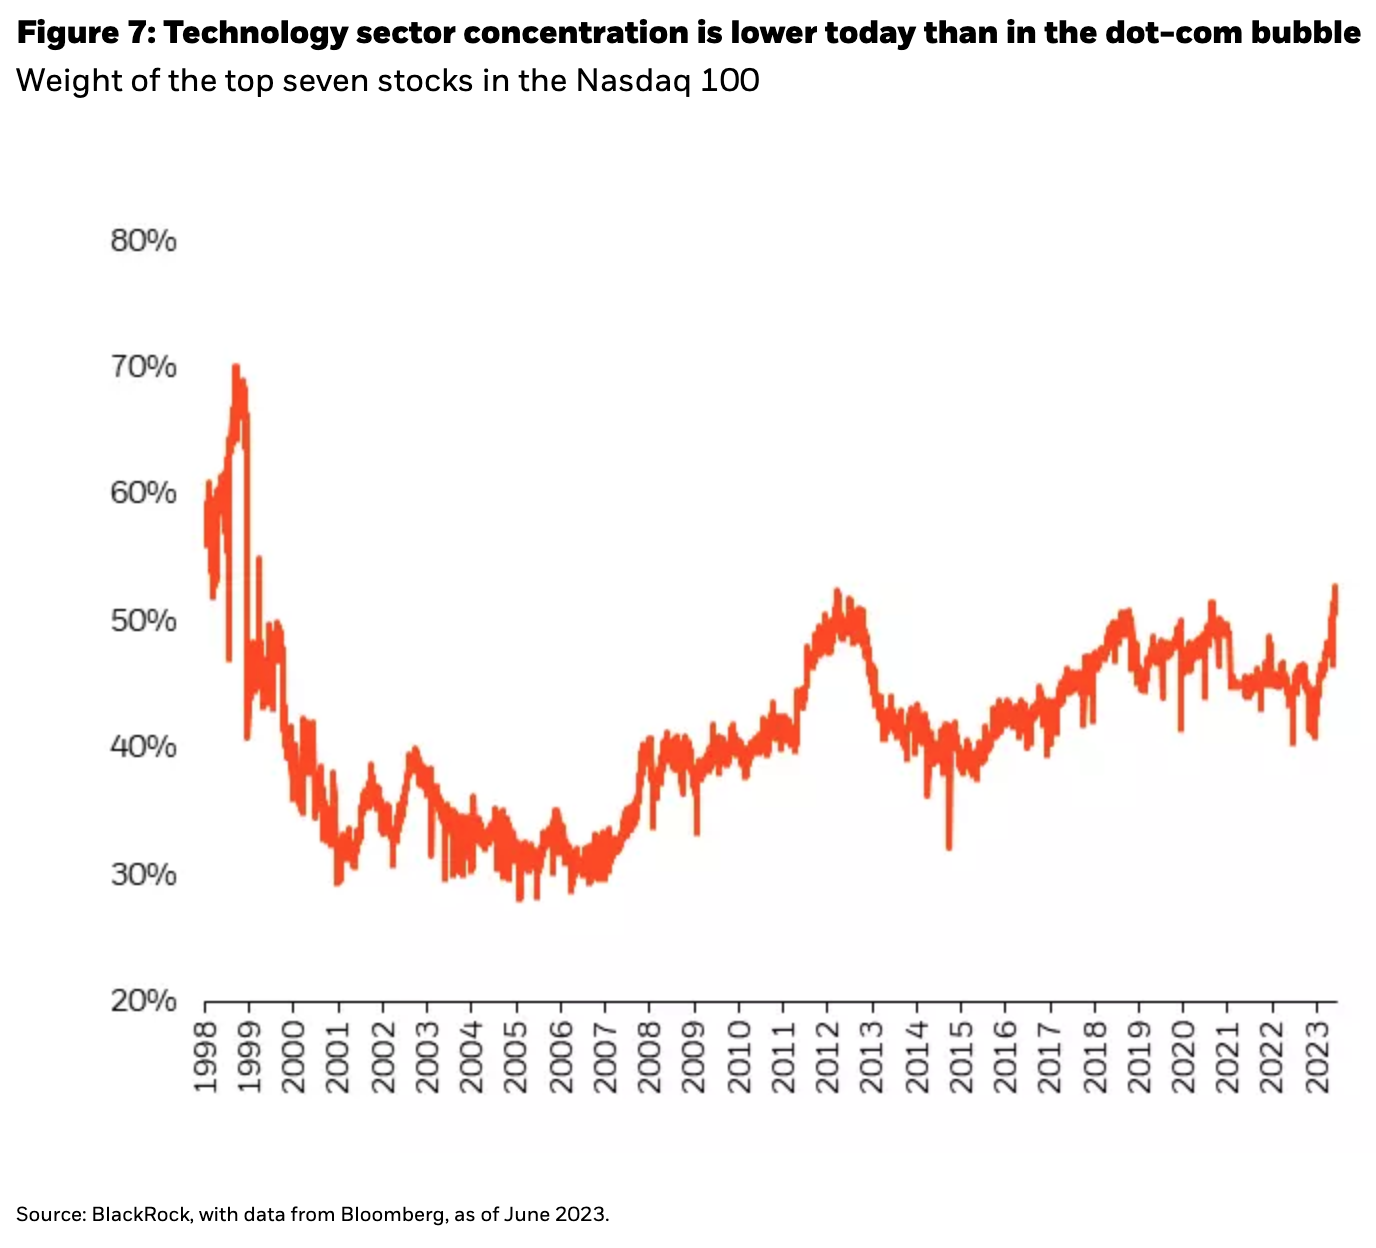
Concentration in the technology sector was higher leading up to the dot-com burst. In 1998, the top seven names of the Nasdaq 100 explained ~65% of returns. Today, that’s closer to 50% (Figure 7).
A brighter outlook for broader equity markets
The rest of the equity market appears to be catching up. Market breadth has notably improved in recent weeks. Positive performance has extended to more economically sensitive segments including cyclicals, commodity industries, and value styles.
Valuations are attractive across several segments of the market. Despite the broadening of the rally, many industries are trading at valuations that are in line with, or in some cases, below levels typically associated with a recession. This provides runway for market breadth to continue to improve—particularly if the hard landing scenario can be avoided for longer.
Equity market positioning and opportunities
As market breadth returns, we see opportunities emerging across a broader opportunity set, including more economically sensitive cyclical stocks. This aligns with our view that inflation may be improving faster than policymakers acknowledge, and the economy may be on more stable footing. As it relates to the AI theme, we’re focused on taking a more selective approach by differentiating genuine AI winners from those who participated in the initial rally but may be less likely to lead in the space long-term.
As systematic investors, we use alternative data to identify these granular security selection insights and capture cross-sectional opportunities as they emerge. For example, we use natural language processing techniques to analyze the text of historic company earnings transcripts at scale. This allows us to differentiate companies who have been innovating in the AI space for some time, versus those who have benefitted from mentioning AI in recent communications. We also use online job postings data to identify companies across industries who are hiring for AI-related roles—a sign of commitment to integrating AI into their business models.
It’s worth noting, as early adopters of AI in our investment process, many of our investment insights are now powered by the latest innovations in AI. Within BlackRock Systematic, we’ve enhanced our natural language processing capabilities to leverage the same transformer technology used in AI applications like ChatGPT. These technologies help us to maximize the precision and accuracy of text analysis.
Conclusion
So far in 2023, equity markets have shrugged off banking stress, recession risk, and monetary tightening in favor of a more optimistic view. While risks remain, alternative data suggests that inflation may fall faster than expected as the economy remains relatively healthy. We see room to run for the AI theme and equity markets more broadly. In our view, systematic investment processes may help better identify winners across industries in the months ahead, by employing a granular, data-driven approach to security selection.
Copyright © BlackRock