Pre-opening Comments for Monday July 3rd
Editor’s Note: Next Tech Talk report will be released on Wednesday July 5th
U.S. equity index futures were lower this morning. S&P 500 futures were down 4 points at 8:30 AM EDT.
Trading activity in U.S. equity markets is expected to be well below average prior to the July 4th holiday. Equity markets finish trading at 1:00 PM EDT.
The Toronto Exchange is close today for a holiday.
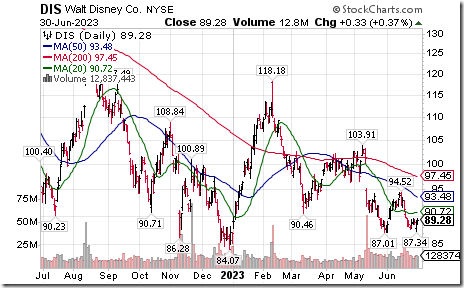
Disney slipped $0.18 to $89.10 after its Indiana Jones sequel opened with lower than expected box office revenues.
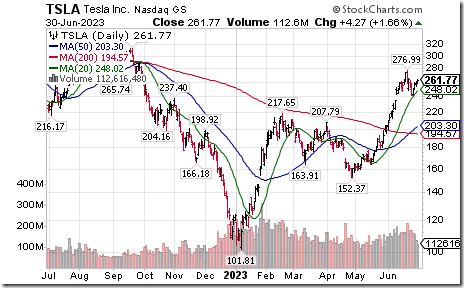
Tesla advanced $4.27 to $261.77 after announcing record production and sales in the second quarter.
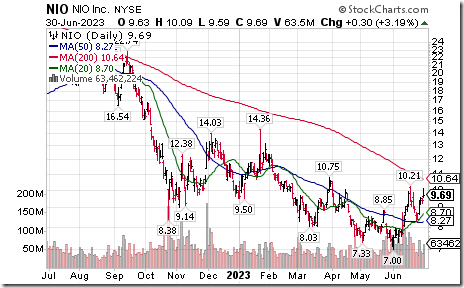
NIO gained $0.47 to $10.16 after announcing a recovery in EV deliveries.
The Bottom Line
Calm before the storm! Expected corporate news from major U.S. and Canadian companies this week is exceptionally quiet. Many corporations have entered their “quiet time” approximately 10 days prior to release of quarterly results. Volumes on North American equity markets typically are well below average this week. Bid/Ask spreads widen. Traders are on holidays including the Canada Day holiday celebrated by Canadian equity markets on Monday and the U.S. Independence Day holiday on Tuesday.
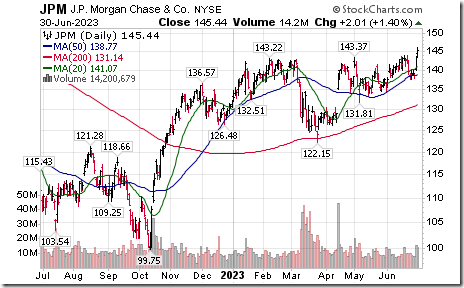
Then comes the storm! Second quarter corporate results by large U.S. and Canadian companies start to appear in volume in the second week in July. Leading the report season are the money center banks. They have exciting news to offer the market. Last week the Federal Reserve confirmed that 27 of the largest banks in the U.S. passed their monetary fitness test, setting the stage for banks to announce increases in their dividend and share buyback programs. Favourable anticipation of good news will help to support additional gains by North American equity indices this week. Note breakouts by JP Morgan, Master Card and Visa on Friday.
Economic news this week also will have an influence on equity prices. U.S. economic news is expected to be mildly favourable relative to the previous month. Improvements are expected for the June ISM Manufacturing PMI, the June ISM Non-manufacturing PMI and the May Trade Deficit reports.
And now, potentially bad news! Despite encouraging quarterly news from major U.S. banks in the second quarter, consensus estimates predict a “rocky” report period for other broadly based Canadian and U.S. companies. According to www.FactSet.com , consensus earnings on a year-over-year basis for S&P 500 companies calls for a drop 6.4% and consensus revenues calls for a slip of 0.4%. On the other hand, second quarter earnings results are expected to be the low point for earnings and revenue changes in the current economic cycle. According to www.FactSet.com, S&P 500 consensus for the third quarter on a year-over-year basis calls for an increase of 0.8% in earnings and a 1.2% in revenues. Consensus for the fourth quarter calls for an 8.2% in earnings and a 3.2% in revenues. Consensus for 2024 calls for an increase of 12.3% in earnings and a 4.9% increase in revenues. Question: When will equity prices begin to respond to improving earnings and revenue expectations starting after the second quarter results are released? Responses to truly horrible second quarter results could give us the answer.
History shows that seasonal influences on equity prices in the month of July are exceptionally positive. During the past 20 July periods, the TSX Composite and its related ETF:XIU.TO have gained an average of 2.2% per period and the S&P 500 Index and related ETF: SPY have gained an average of 2.1% per period. Economic sensitive sectors including technology, industrials and consumer discretionary led the gains. Following is a link offered by Julius de Kempenaer giving history for the S&P 500 and major sectors during the past 20 Julys
Stocks Lining Up for a Strong July | Julius de Kempenaer | Sector Spotlight (06.26.23) – YouTube
Economic News This Week
U.S. May Construction Spending released at 10:00 AM EDT on Monday is expected to increase 0.5% versus a gain of 1.2% in April.
June ISM Manufacturing PMI released at 10:00 AM EDT on Monday is expected to increase to 47.2 from 46.9 in May.
FOMC Meeting Minutes are released at 2:00 PM EDT on Wednesday.
May U.S. Trade Deficit released at 8:30 AM EDT on Thursday is expected to slip to $69.80 billion versus a deficit of $74.60 billion in April
May Canadian Merchandise Trade is released at 8:30 AM EDT on Thursday. It recorded a surplus of $1.94 billion in April.
June ISM Non-manufacturing ISM PMI released at 8:30 AM EDT on Thursday is expected to increase to 50.5 from 50.3 in May.
June Non-farm Payrolls released at 8:30 AM EDT on Friday are expected to increase 200,000 versus a gain of 339,000 in April. June Unemployment Rate is expected to remain unchanged at 3.7% reported in May. June Average Hourly Earnings are expected to increase 0.3% versus a gain of 0.3% in May.
June Canadian Employment is released at 8:30 AM EDT on Friday. May Employment dropped 17,300 in May. May Unemployment Rate was 5.2%.
Selected Earnings News This Week
Nil
Trader’s Corner
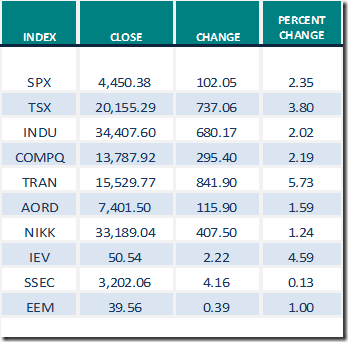
Equity Indices and Related ETFs
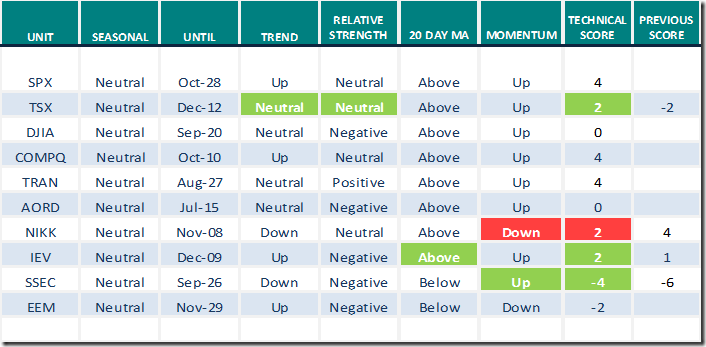
Daily Seasonal/Technical Equity Trends for June 30th 2023
Green: Increase from previous day
Red: Decrease from previous day
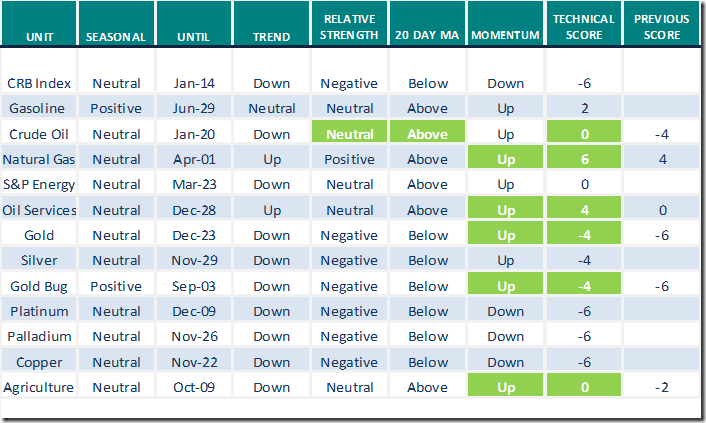
Commodities
Daily Seasonal/Technical Commodities Trends for June 30th 2023
Green: Increase from previous day
Red: Decrease from previous day
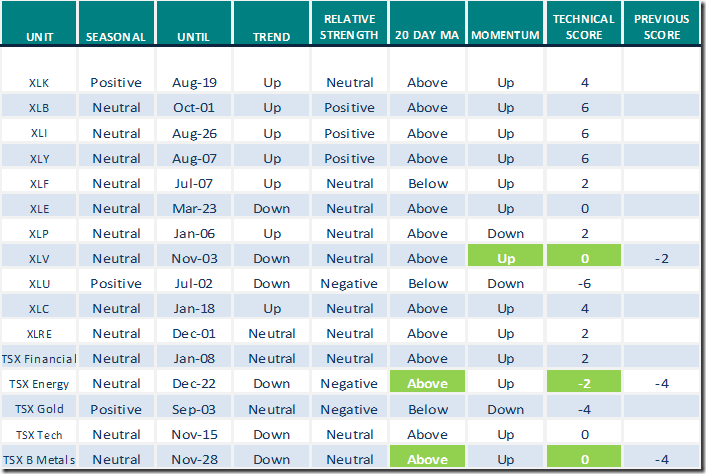
Sectors
Daily Seasonal/Technical Sector Trends for June 30th 2023
Green: Increase from previous day
Red: Decrease from previous day
Source for positive seasonal ratings: www.equityclock.com
Technical Scores
Calculated as follows:
Intermediate Uptrend based on at least 20 trading days: Score 2
(Higher highs and higher lows)
Intermediate Neutral trend: Score 0
(Not up or down)
Intermediate Downtrend: Score -2
(Lower highs and lower lows)
Outperformance relative to the S&P 500 Index: Score: 2
Neutral Performance relative to the S&P 500 Index: 0
Underperformance relative to the S&P 500 Index: Score –2
Above 20 day moving average: Score 1
At 20 day moving average: Score: 0
Below 20 day moving average: –1
Up trending momentum indicators (Daily Stochastics, RSI and MACD): 1
Mixed momentum indicators: 0
Down trending momentum indicators: –1
Technical scores range from -6 to +6. Technical buy signals based on the above guidelines start when a security advances to at least 0.0, but preferably 2.0 or higher. Technical sell/short signals start when a security descends to 0, but preferably -2.0 or lower.
Long positions require maintaining a technical score of -2.0 or higher. Conversely, a short position requires maintaining a technical score of +2.0 or lower
Changes Last Week
Links offered by valued providers
Michael Campbell’s Money Talks for July 1st
Michael Campbell’s MoneyTalks – Complete Show (mikesmoneytalks.ca)
Uranium price update by Sprott Securities
Uranium Update from Per’s Cabin (sprott.com)
Mark Lebovit’s Weekly Comment on www.HoweStreet.com
Commodities, Inflation, Food Prices, Full Moon – HoweStreet
The Second Half Equities Super Bowl JUNE 30 Greg Schnell
The Second Half Equities Super Bowl | The Canadian Technician | StockCharts.com
What’s Next for QQQ: Super Bullish to Super Bearish JUNE 30, 2023 David Keller
What’s Next for QQQ: Super Bullish to Super Bearish | The Mindful Investor | StockCharts.com
Is the Stock Market Overvalued? Here’s How To Know JUNE 30, 2023
Jayanthi Gopalakrishnan
Is the Stock Market Overvalued? Here’s How To Know | ChartWatchers | StockCharts.com
U.S. Oil Reserves Drop to 40-Year Lows JUNE 28, 2023 Mish Schneider
U.S. Oil Reserves Drop to 40-Year Lows | Mish’s Market Minute | StockCharts.com
Five Reasons The Economy Has Shifted to “Rolling Expansion”:
Mark Bunting and www.uncommonsenseinvestor.com
https://uncommonsenseinvestor.com/five-reasons-economy-has-shifted-to-rolling-expansion/
Bob Hoye Jun 30, 2023: Interest Rates, Currencies, Mortgages, Gold Climate Change and Witches
Interest Rates, Currencies, Mortgages, Gold – HoweStreet
Victor Adair Trading Desk Notes For July 1, 2023
Trading Desk Notes For July 1, 2023 – HoweStreet
Technical Notes for Friday
JP Morgan Chase $JPM a Dow Jones Industrial Average stock moved above $143.37 extending an intermediate uptrend.
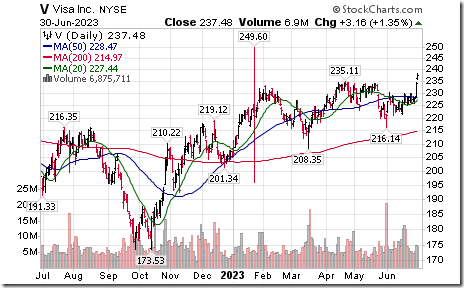
Visa $V a Dow Jones Industrial Average stock moved above $235.11 extending an intermediate uptrend.
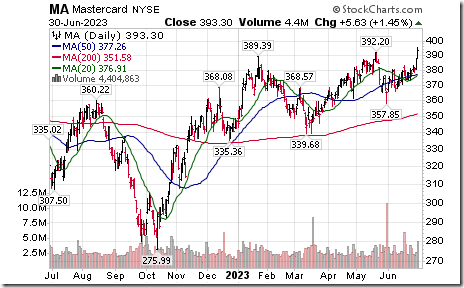
MasterCard MA an S&P 100 stock moved above $392.20 extending an intermediate uptrend.
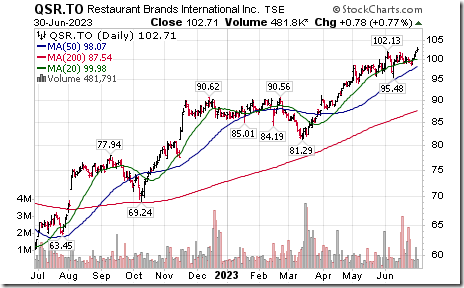
Restaurant Brands International $QSR.TO a TSX 60 stock moved above Cdn$102.13 to an all-time high extending an intermediate uptrend.
S&P 500 Momentum Barometers
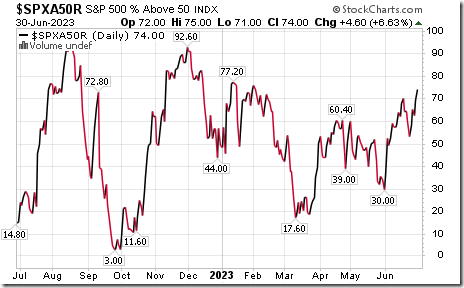
The intermediate term Barometer advanced 4.60 to 74.00 on Friday and 20.60 last week to 74.00. It remains Overbought. Daily trend is up.
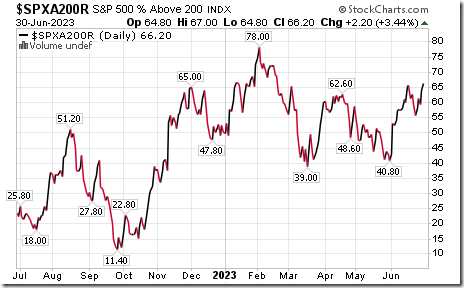
The long term Barometer added 2.20 on Friday and 10.60 last week to 66.20. It changed from Neutral to Overbought. Daily trend is up.
TSX Momentum Barometers
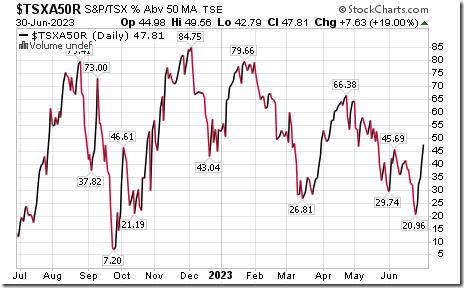
The intermediate term Barometer added 7.63 on Friday and 26.85 last week to 47.81. It changed from Oversold to Neutral on a move above 40.00. Daily trend is up
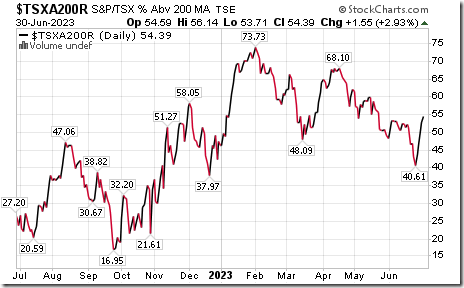
The long term Barometer added 1.55 on Friday and 13.78 last week to 54.39. It remains Neutral Daily trend is up.
Disclaimer: Seasonality ratings and technical ratings offered in this report and at
www.equityclock.com are for information only. They should not be considered as advice to purchase or to sell mentioned securities. Data offered in this report is believed to be accurate, but is not guaranteed


