by Don Vialoux, EquityClock.com
The Bottom Line
Focus this week is on the FOMC meeting on May 3-4. Consensus says the FOMC will increase the Fed Fund rate by 0.50% to 1.00%. Guidance when results of the meeting are released at 2:00 PM EDT on Wednesday will have significant impact on equity and bond prices, one way or the other. Remember Wall Street’s famous expression for equity investors “Don’t fight the Fed”.
Observations
Consensus earnings estimate for S&P 500 companies on a year-over-year basis in the first quarter of 2022 increased again last week. According to www.FactSet.com first quarter earnings on a year-over-year basis are expected to increase 7.1% (versus 6.6% last week) and revenues are expected to increase 12.2% (versus 11.1% last week)
Consensus earnings estimates for S&P 500 companies beyond the first quarter on a year-over-year basis were reduced slightly. According to www.FactSet.com second quarter earnings are expected to increase 5.5% (versus 7.0% last week) and revenues are expected to increase 9.7% (versus 9.9% last week). Earnings in the third quarter are expected to increase 11.7% and revenues are expected to increase 8.8%. Earnings in the fourth quarter are expected to increase 11.2% (versus 11.4% last week) and revenues are expected to increase 7.2%. Earnings on a year-over-year basis for all of 2022 are expected to increase 11.0% (versus 10.9% last week) and revenues are expected to increase 9.8% (versus 9.5% last week).
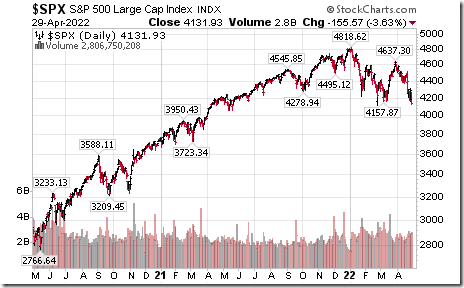
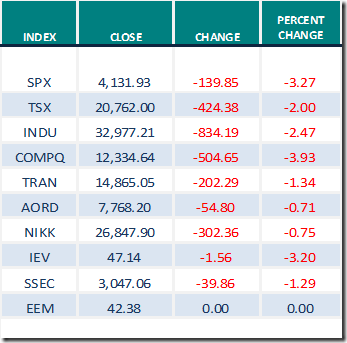
The S&P 500 Index closed on Friday at an 11 month closing low moving below previous closing lows set in March.
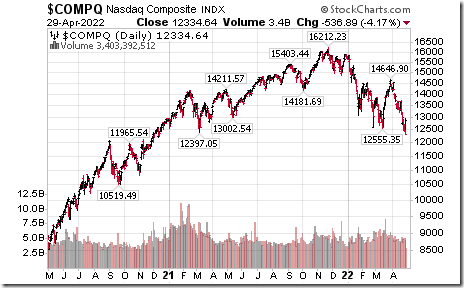
The NASDAQ Composite Index closed at an 18 month low
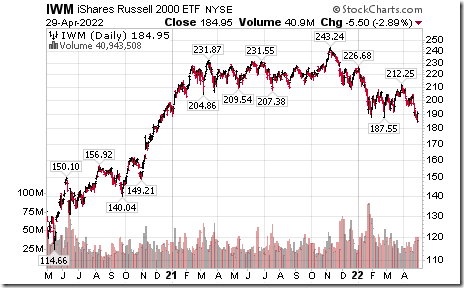
The Russell 2000 Index and related ETF also closed at an 18 month low.
CNN Fear & Greed Index dropped last week from 40 to 27. See https://www.cnn.com/markets/fear-and-greed
Sell in May and Go Away?
EquityClock updated a study on the strategy in today’s www.EquityClock.com Tradition claims that virtually all of gains by the S&P 500 Index and Dow Jones Industrial Average occur from the end of October to the end of April each year. Therefore, investors holding U.S. equities and related ETSs should “Sell in May and go away”. While returns historically have been higher for these indices from the end of October to the end of April since 1950, EquityClock found that returns from end of April to end of October also are positive, but on a less frequent basis. Of greater importance, selected defensive sectors offer above average returns during the end of April to end of October periods. Check out the updated study at www.EquityClock.com
Economic News This Week
Official holidays are held on Monday in Russia, China and the United Kingdom.
March Construction Spending to be released at 10:00 AM EDT on Monday is expected to increase 0.8% versus a gain of 0.5% in February.
April ISM Manufacturing ISM to be released at 10:00 AM EDT on Monday is expected to increase to 58.0 from 57.1 in March.
March Factory Orders to be released at 10:00 AM EDT on Tuesday are expected to increase 1.2% versus a decline of 0.5% in February.
April ADP private employment report to be released at 8:15 AM EDT on Wednesday is expected to slip to 370,000 from 455,000 in March.
April U.S. Trade Deficit to be released at 8:30 AM EDT on Wednesday is expected to ease to $86.90 billion from $89.20 billion in March.
April Canadian Trade Balance to be released at 8:30 AM EDT on Wednesday is expected to record a surplus of $2.90 billion versus a surplus of $2.66 billion in March.
April ISM Non-manufacturing PMI to be released at 10:00 AM EDT on Wednesday is expected to increase to 59.0 from 58.3 in March.
FOMC statement on the Fed Fund Rate is released at 2:00 PM EDT on Wednesday. The Rate is expected to increase from 0.50% to 1.25%. Press conference with Chairman Powell is offered at 2:30 PM EDT.
First quarter 2022 Non-farm Productivity to be released at 8:30 AM EDT on Thursday is expected to drop 2.3% versus a gain of 6.6% in the fourth quarter 2021.
April Non-farm Payrolls to be released at 8:30 AM EDT on Friday is expected to be 400,000 versus 431,000 in March. April Unemployment Rate is expected to remain unchanged from March at 3.6%. April Average Hourly Earnings are expected to increase 0.4% versus a gain of 0.4% in March (5.5% on a year-over-year basis versus 5.6% in March).
April Canadian Employment to be released at 8:30 AM EDT on Friday is expected to record a 80,000 increase versus a gain of 72,500 in March.
Selected Earnings Reports This Week
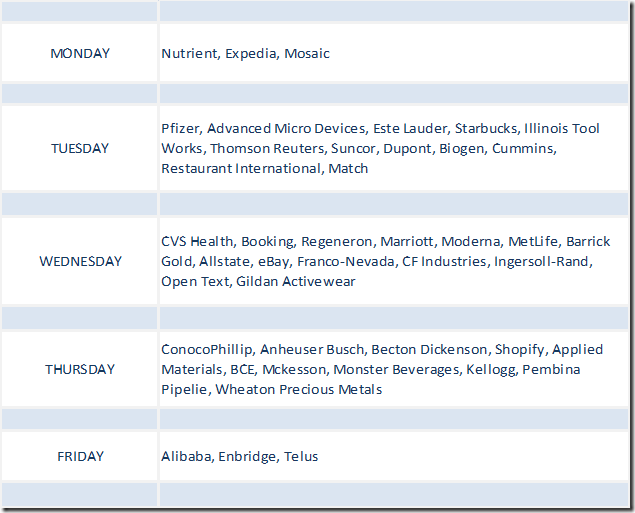
Another 160 S&P 500 companies (32%) are scheduled to report quarterly results this week. Fifty five percent have reported to date. Focus this week is on Healthcare and Consumer Staples companies.
Frequency of reports by TSX 60 companies ramps up this week.
Trader’s Corner
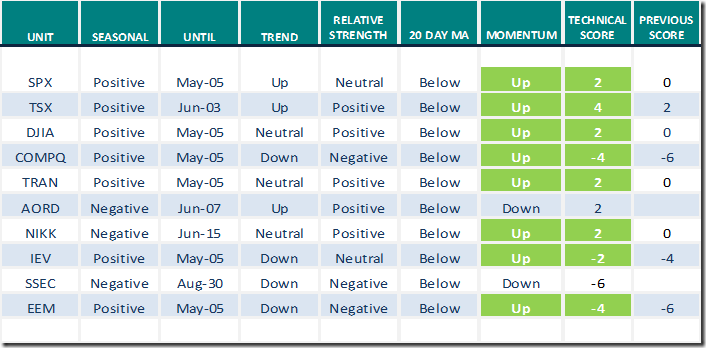
Equity Indices and Related ETFs
Daily Seasonal/Technical Equity Trends for April 29th 2022
Green: Increase from previous day
Red: Decrease from previous day
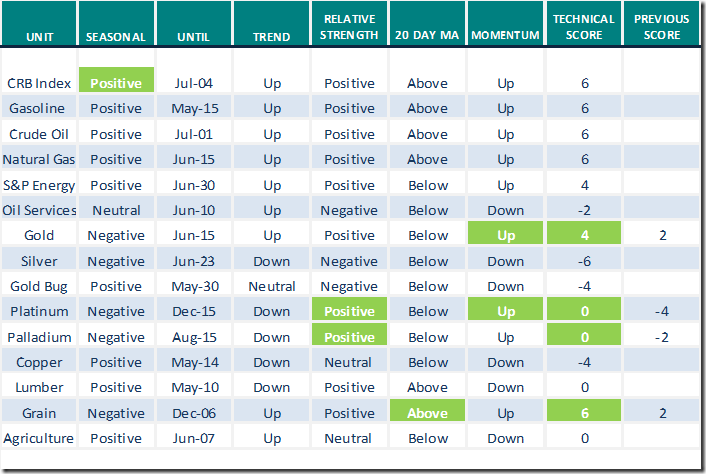
Commodities
Daily Seasonal/Technical Commodities Trends for April 29th 2022
Green: Increase from previous day
Red: Decrease from previous day
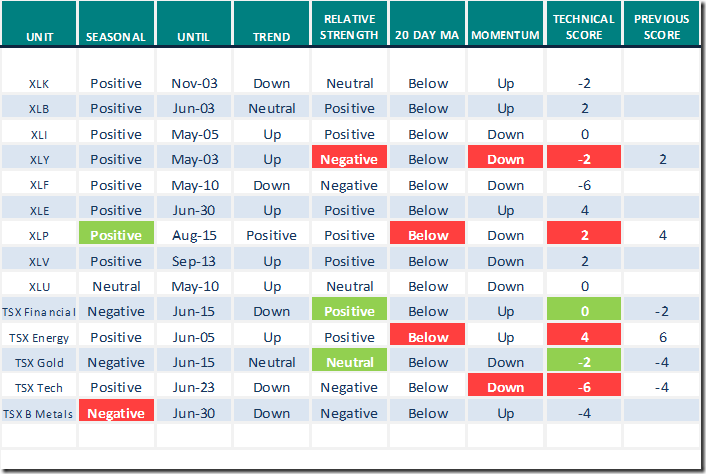
Sectors
Daily Seasonal/Technical Sector Trends for April 29th 2021
Green: Increase from previous day
Red: Decrease from previous day
All seasonality ratings are based on performance relative to the S&P 500 Index (except TSX)
Links offered by Valued Providers
Mark Leibovit’s Weekly Comment for April 29th
Gold, Silver, Inflation, Interest Rates, Bonds – HoweStreet
David Keller from www.StockCharts.com and Jeff Huge from JWH Investments asks “S&P 500 downside to 3,600’?
https://www.youtube.com/watch?v=ufkAGr-PUus
David Keller notes “Key sentiment indicators at bearish extremes”. Following is a link:
Key Sentiment Indicator at Bearish Extreme | The Mindful Investor | StockCharts.com
Leslie Jouflas discuss “Weekly S&P 500 Head & Shoulders Chart Pattern”
Weekly $SPX Head and Shoulders Chart Pattern | Top Advisors Corner | StockCharts.com
Greg Schnell discusses “Regime Change in Equity Markets”
CMT Association Hosts 49th Symposium | ChartWatchers | StockCharts.com
Michael Campbell’s Money Talks for April 30th
https://mikesmoneytalks.ca/april-30th-episode/?mc_cid=d18a6896f3&mc_eid=592546b4b5
Greg Harmon asks “How low can it go”?
https://www.youtube.com/watch?v=fAwq__8GQJ8
Victor Adair’s Trading Desk Notes for April 30th
https://victoradair.ca/trading-desk-notes-for-april-30-2022/
Wyckoff rules: Where next for the stock market? Includes a chart of the Dow Jones Industrial Average from 1897 showing a ten year low in the middle of the second year of the decade (e.g. 2022).
https://www.youtube.com/watch?v=vSCWrIUbJXQ
Technical Scoop for May 2nd from David Chapman and www.EnrichedInvesting.com
Technical Scores
Calculated as follows:
Intermediate Uptrend based on at least 20 trading days: Score 2
(Higher highs and higher lows)
Intermediate Neutral trend: Score 0
(Not up or down)
Intermediate Downtrend: Score -2
(Lower highs and lower lows)
Outperformance relative to the S&P 500 Index: Score: 2
Neutral Performance relative to the S&P 500 Index: 0
Underperformance relative to the S&P 500 Index: Score –2
Above 20 day moving average: Score 1
At 20 day moving average: Score: 0
Below 20 day moving average: –1
Up trending momentum indicators (Daily Stochastics, RSI and MACD): 1
Mixed momentum indicators: 0
Down trending momentum indicators: –1
Technical scores range from -6 to +6. Technical buy signals based on the above guidelines start when a security advances to at least 0.0, but preferably 2.0 or higher. Technical sell/short signals start when a security descends to 0, but preferably -2.0 or lower.
Long positions require maintaining a technical score of -2.0 or higher. Conversely, a short position requires maintaining a technical score of +2.0 or lower
Changes Last Week
Technical Notes released on Friday at
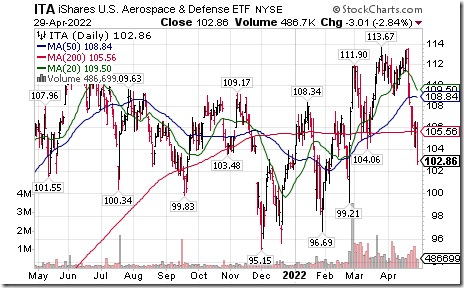
U.S. Aerospace and Defense iShares $ITA moved below $104.06 extending an intermediate downtrend.
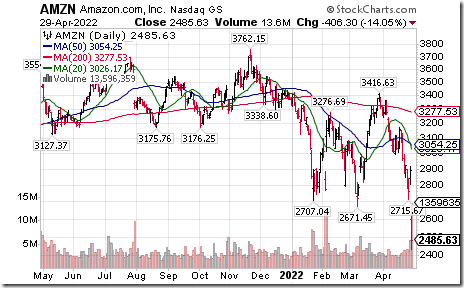
Amazon $AMZN moved below $2,671.45 on lower than consensus quarterly earnings extending an intermediate downtrend.
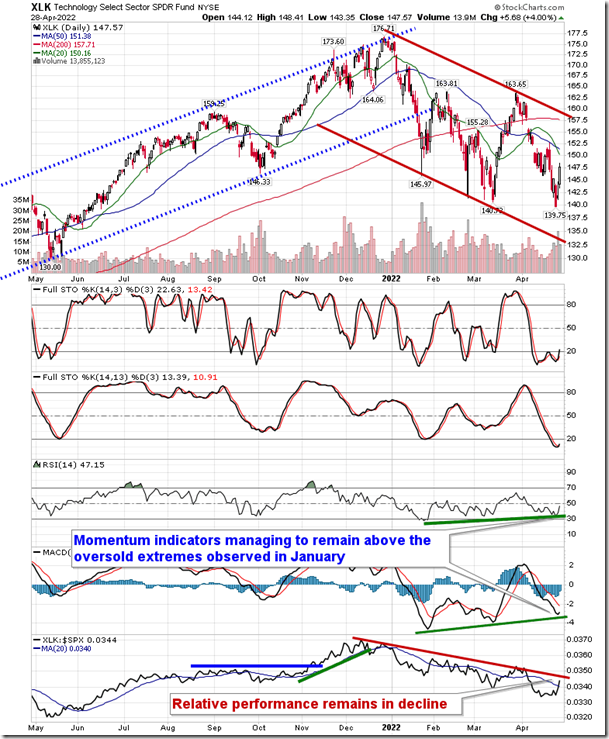
The trend of underperformance in the technology sector continues to provide something to avoid, but the fact that momentum indicators are remaining above the oversold extremes seen in January provides a glimmer of hope that selling pressures are becoming exhausted. equityclock.com/2022/04/28/… $XLK $VGT $IYW $AAPL $INTC
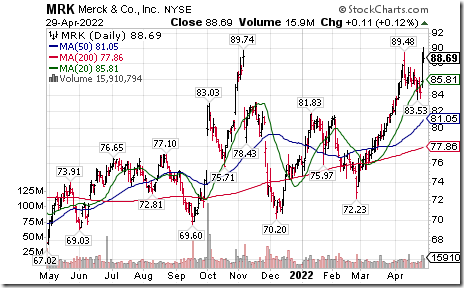
Merck $MRK a Dow Jones Industrial Average stock moved above $89.48 and $89.74 to an all-time high extending an intermediate uptrend. Seasonal influences are favourable to June 26th. If a subscriber to EquityClock, see seasonality chart at https://charts.equityclock.com/merck-co-inc-nysemrk-seasonal-chart
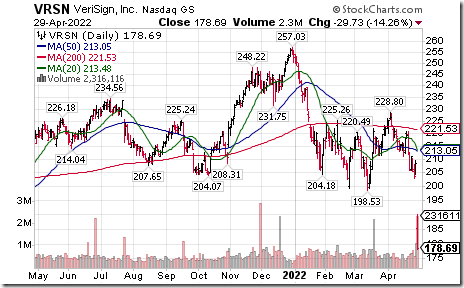
Verisign $VRSN a NASDAQ 100 stock moved below $198.53 extending an intermediate downtrend.
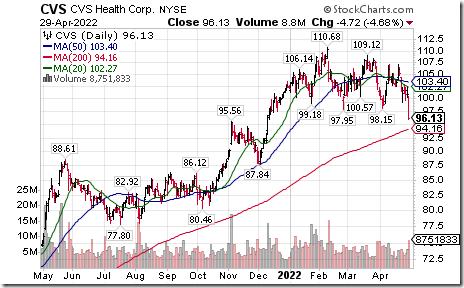
CVS Health $CVS an S&P 100 stock moved below $98.15 extending an intermediate downtrend.
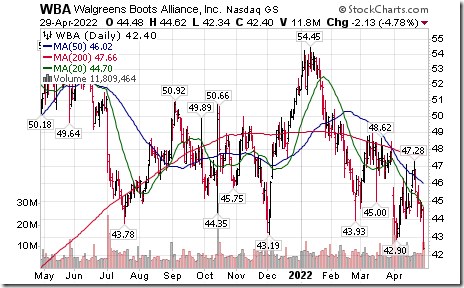
Wallgreens Boots $WBA a Dow Jones Industrial Average stock moved below $42.90 extending an intermediate downtrend
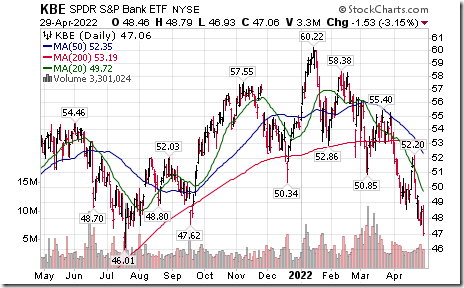
Major U.S. Bank SPDRs $KBE moved below $47.62 extending an intermediate downtrend
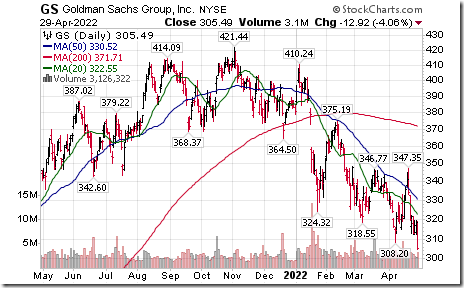
Goldman Sachs $GS a Dow Jones Industrial Average stock moved below $308.20 extending an intermediate downtrend.
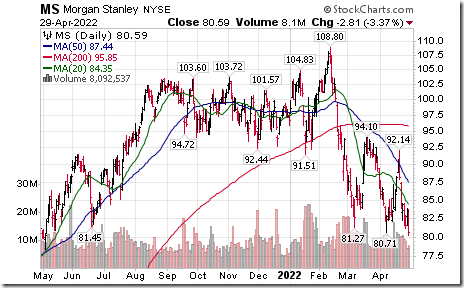
Morgan Stanley $MS an S&P 100 stock moved below $80.71 extending an intermediate downtrend.
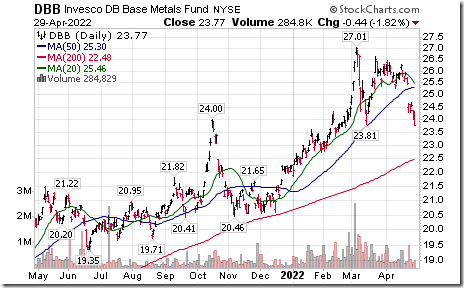
Base Metals ETN (1/3 each in Copper, Zinc, Aluminum) $DBB moved below $23.81 completing a double top pattern.
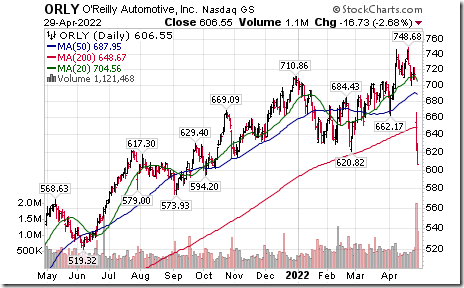
O’Reilly Automotive $ORLY a NASDAQ 100 stock moved below $620.82 extending an intermediate downtrend.
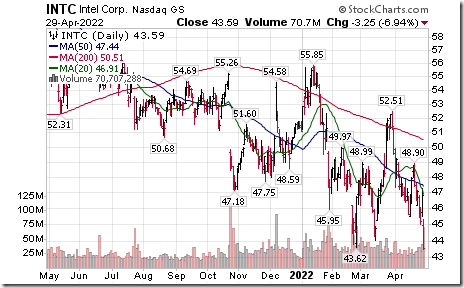
Intel $INTC a Dow Jones Industrial Average stock moved below $43.62 extending an intermediate downtrend.
S&P 500 Momentum Barometers
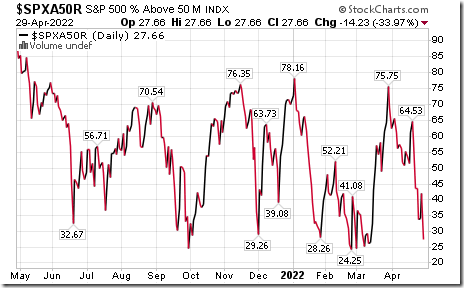
The intermediate term Barometer plunged 14.23 to 27.66 on Friday and 16.03 last week to 27.66. It changed from Neutral to Oversold on a drop below 40.00. Trend remains down.
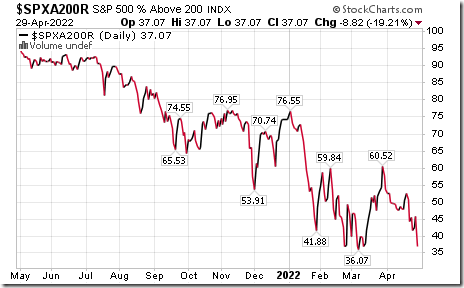
The long term Barometer dropped 8.82 on Friday and 7.42 last week to 37.07. It changed from Neutral to Oversold on a drop below 40.00. Trend remains down.
TSX Momentum Barometers
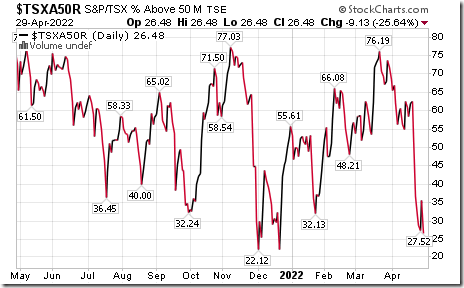
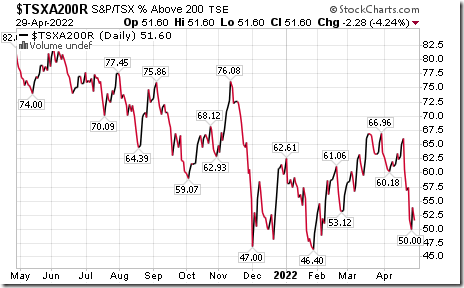
The intermediate term Barometer dropped 9.13 on Friday and 10.22 last week to 26.48. It remains Oversold. Trend remains down.
The long term Barometer slipped 2.28 on Friday and 5.28 last week to 51.50. It remains Neutral. Trend remains down.
Disclaimer: Seasonality and technical ratings offered in this report and at
www.equityclock.com are for information only. They should not be considered as advice to purchase or to sell mentioned securities. Data offered in this report is believed to be accurate, but is not guaranteed.
This post was originally publised at Vialoux's Tech Talk.


