by Don Vialoux, EquityClock.com
Technical Notes released yesterday at
S&P 100 and NASDAQ 100 stocks that broke intermediate support levels this morning included $CVX $BLK $MU $FDX $DHR and $DD
Editor’s Note: Following release of this comment, add $ADBE, $ADSK, $SLB
Precious metals prices $SLV $GLD have moved below intermediate support. Precious metal equity prices have followed. Breakdowns below intermediate support include $ABX.CA and $AEM.CA
Weakness in Chinese equity indices $SSEC and related ETFs and closed end funds (e.g.$CAF) due to increased COVID 19 restrictions in China are impacted related Far East and Emerging Markets ETFs $EWY $FM
Lithium ETN $LIT moved below $65.61 extending an intermediate downtrend.
U.S. Brokers iShare $IAI moved below $93.06 extending an intermediate downtrend.
Financial SPDRs $XLF moved below $35.35 extending an intermediate downtrend
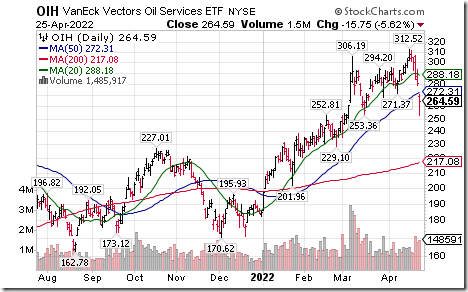
Oil Services ETF $OIH moved below $253.36 completing a double top pattern.
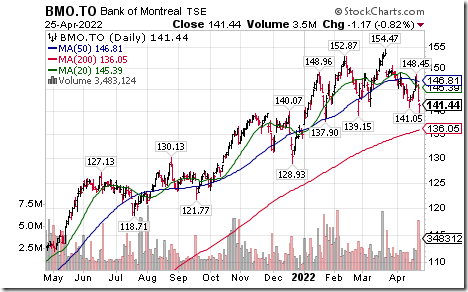
Canadian bank stocks and related ETFs $ZEB.CA $XFN.CA remain under terchnical pressure. $BMO.CA moved below $141.05 and $139.15 extending an intermediate downtrend.
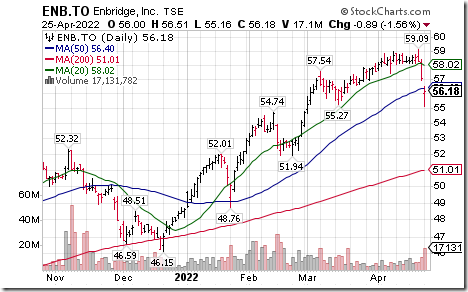
Enbridge $ENB.CA a TSX 60 stock moved below intermediate support at $55.27.
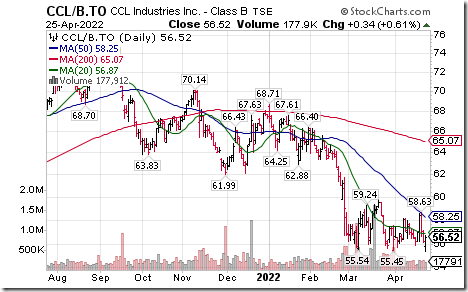
CCL Industries $CCL.B.CA a TSX 60 stock moved below $55.45 extending an intermediate downtrend.
Trader’s Corner
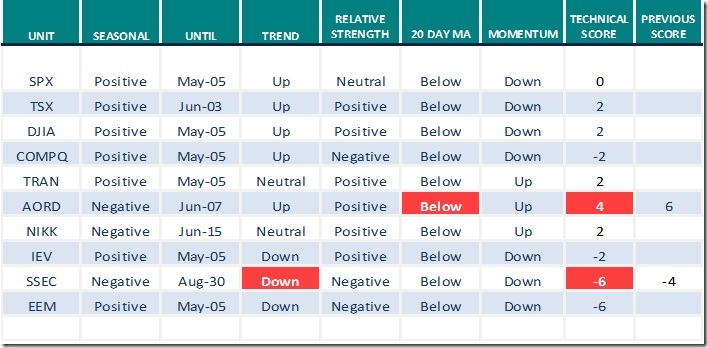
Equity Indices and Related ETFs
Daily Seasonal/Technical Equity Trends for April 25th 2022
Green: Increase from previous day
Red: Decrease from previous day
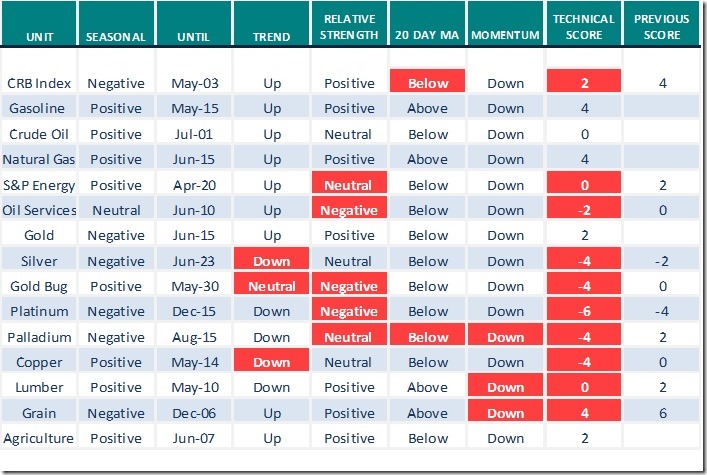
Commodities
Daily Seasonal/Technical Commodities Trends for April 25th 2022
Green: Increase from previous day
Red: Decrease from previous day
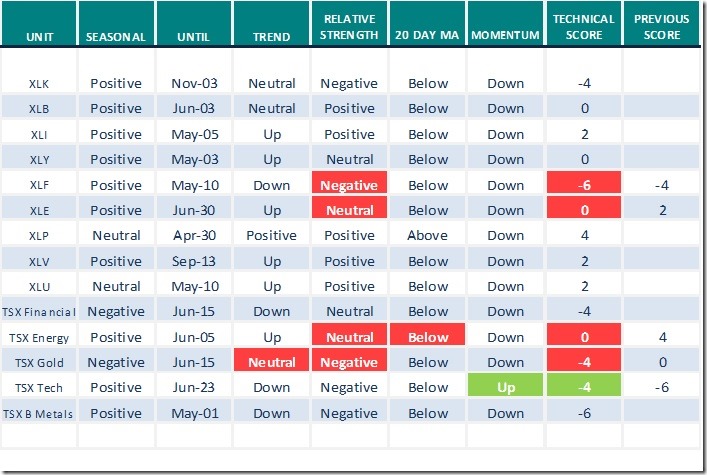
Sectors
Daily Seasonal/Technical Sector Trends for April 25th 2021
Green: Increase from previous day
Red: Decrease from previous day
All seasonality ratings are based on performance relative to the S&P 500 Index (except TSX)
S&P 500 Momentum Barometers
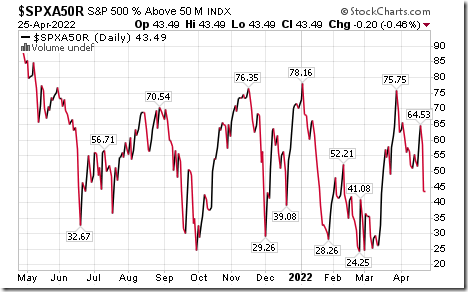
The intermediate term Barometer slipped 0.20 to 43.49 yesterday. It remains Neutral. Trend is down.
The long term Barometer added 1.20 to 45.69 yesterday. It remains Neutral.
TSX Momentum Barometers
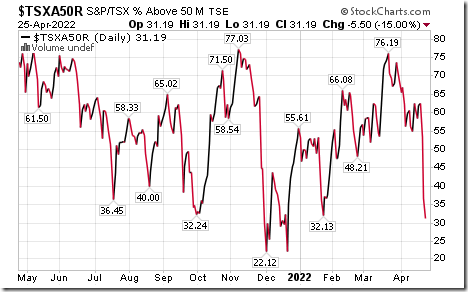
The intermediate term Barometer dropped 5.50 to 31.19 yesterday. It remains Oversold. Trend is down.
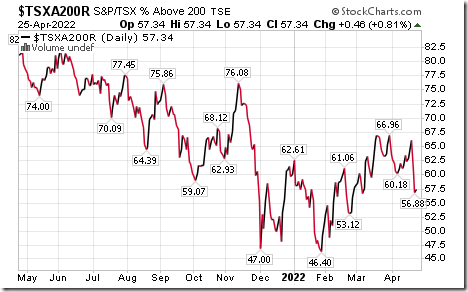
The long term Barometer added 0.46 to 57.34 yesterday. It remains Neutral.
Disclaimer: Seasonality and technical ratings offered in this report and at
www.equityclock.com are for information only. They should not be considered as advice to purchase or to sell mentioned securities. Data offered in this report is believed to be accurate, but is not guaranteed.
This post was originally publised at Vialoux's Tech Talk.


