
by Stephen Duench, CFA®, AGF Management Ltd.
The start of the U.S. Federal Reserve’s latest rate-hiking cycle has some investors keeping close watch on the shape of the U.S. Treasury yield curve – and who can blame them? After all, if short-term rates continue to climb higher – and end up being greater than long-term rates – it would lead to an “inverted” yield curve, which has tended to be a very good canary for predicting past recessions, history shows.
But while that may be generally true, it’s important for anyone eyeing the curve to also understand that inversions happen at different segments along the yield curve and at different times. In other words, they are not always created equal. In fact, based on AGFiQ research analyzing S&P 500 Index returns in relation to inverted yield curves that took place between 1977 and 2018, equity investors may not have as much to worry about as they might think – at least for now.
For instance, as it stood earlier today, three segments of the U.S. Treasury curve are now inverted while three other segments are teetering on the brink. Yet, our analysis shows that two of the current inversions – those defined by the five- and 10-year yield spread and the five- and 30-year spread – were associated with some of the best equity returns when stacked up to other inverted segments of the curve over the period examined.
Meanwhile, the third segment of the curve that is now inverted – the two- and 10-year yield spread – was linked to less impressive returns, but generally occurred without pushing S&P 500 performance into the red despite being the inversion that is most typically connected with predicting recessions.
Perhaps even more importantly, spreads between three-month and longer-dated yields, which corresponded to some of the most unattractive returns when inverted in the past, are nowhere near inverting today.
Current Yield Differentials
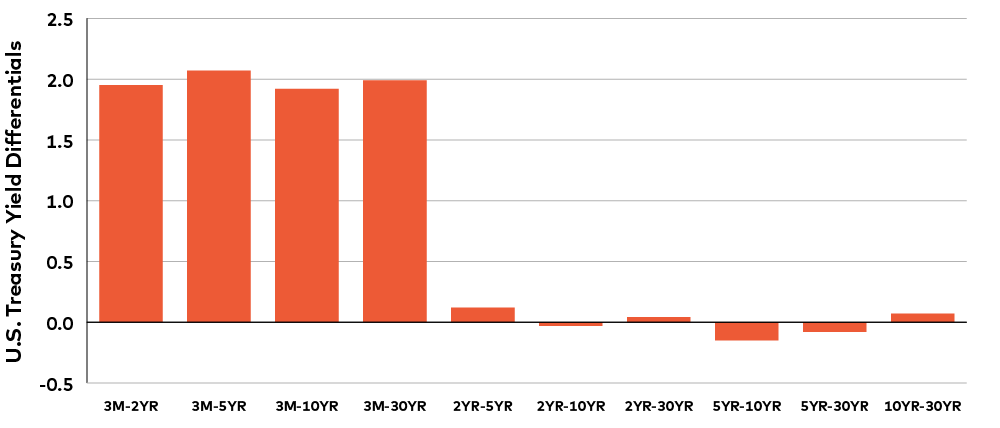
Source: AGFiQ with data from Bloomberg LP as of early intraday trading on April 1, 2022. Yield differentials are calculated by subtracting the shorter-term maturity yield from the longer-term maturity yield for each spread represented in the chart. A negative differential is equal to an inversion of the yield curve.
Our research on yield curve inversions also points out that S&P 500 Index returns remained, on average, positive in the year leading into an inversion, as well as the year following.
The index’s performance did weaken the closer time got to the inversion date. But the inverted spreads that coincided with the worst returns tended to be those involving the three-month Treasury yield and longer-term maturities. Interestingly, an inversion of the two-year and five-year yield corresponded to some of the better intermediate returns found in our research.
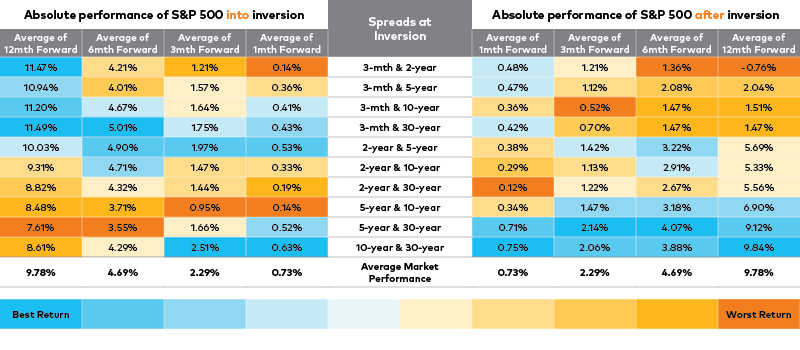
Source: AGFiQ with data from Bloomberg LP. Time frame for data set is 1977 to 2018. Performance has been colour-ranked for each time frame (column) with darkest blue representing best return and darkest orange representing worst return.
The magnitude of previous inversions seemed to play a role in past stock returns as well. The steeper the inversion was, the worse the performance and vice versa. And not surprisingly, forward return profiles were better when fewer spreads along the curve inverted. In fact, it’s only when there were seven or more spread inversions that future S&P 500 performance turned negative and, even then, negative returns were relatively muted.
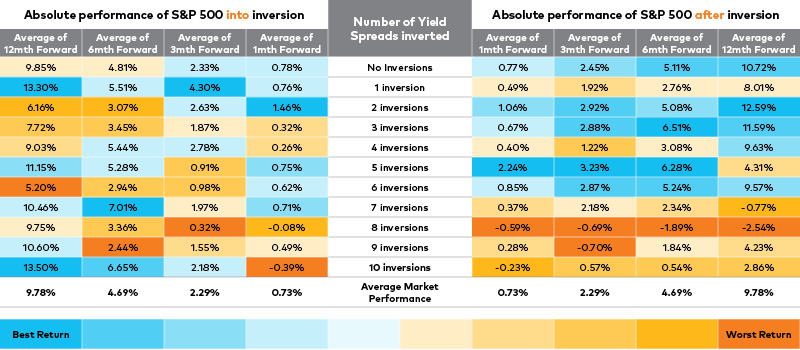
Source: AGFiQ with data from Bloomberg LP. Time frame for data set is January 1977 to 2018. Performance has been colour-ranked for each time frame (column) with darkest blue representing best return and darkest orange representing worst return.
Further to this point, when there were fewer inversions, S&P 500 returns tended to weaken more substantially right before these spreads invert, but then strengthen more aggressively afterwards.
None of this is to suggest that future inversions of the U.S. Treasury curve will lead to similar outcomes for the S&P 500 (or other global equity indexes for that matter). It may, however, provide important perspective at a time of growing economic uncertainty and increasingly volatile markets.
This article is an update from a previous article published on February 6, 2019 under the headline, The ins and outs of past yield curve inversions and stock performance
Click to learn more about our Quantitative capabilities.
The views expressed in this blog are those of the authors and do not necessarily represent the opinions of AGF, its subsidiaries or any of its affiliated companies, funds, or investment strategies.
The commentaries contained herein are provided as a general source of information based on information available as of April 1, 2022 and are not intended to be comprehensive investment advice applicable to the circumstances of the individual. Every effort has been made to ensure accuracy in these commentaries at the time of publication, however, accuracy cannot be guaranteed. Market conditions may change and AGF Investments accepts no responsibility for individual investment decisions arising from the use or reliance on the information contained here.
“Bloomberg®” is a service mark of Bloomberg Finance L.P. and its affiliates, including Bloomberg Index Services Limited (“BISL”) (collectively, “Bloomberg”) and has been licensed for use for certain purposes by AGF Management Limited and its subsidiaries. Bloomberg is not affiliated with AGF Management Limited or its subsidiaries, and Bloomberg does not approve, endorse, review or recommend any products of AGF Management Limited or its subsidiaries. Bloomberg does not guarantee the timeliness, accurateness, or completeness, of any data or information relating to any products of AGF Management Limited or its subsidiaries.
AGFiQ is a quantitative investment platform powered by an intellectually diverse, multi-disciplined team that combines the complementary strengths of investment professionals from AGF Investments Inc. (AGFI), a Canadian registered portfolio manager, and AGF Investments LLC (AGFUS), a U.S. registered adviser.
AGF Investments is a group of wholly owned subsidiaries of AGF Management Limited, a Canadian reporting issuer. The subsidiaries included in AGF Investments are AGF Investments Inc. (AGFI), AGF Investments America Inc. (AGFA), AGF Investments LLC (AGFUS) and AGF International Advisors Company Limited (AGFIA). AGFA and AGFUS are registered advisors in the U.S. AGFI is registered as a portfolio manager across Canadian securities commissions. AGFIA is regulated by the Central Bank of Ireland and registered with the Australian Securities & Investments Commission. The subsidiaries that form AGF Investments manage a variety of mandates comprised of equity, fixed income and balanced assets.
® The “AGF” and ™ “AGFiQ” logos are registered trademarks of AGF Management Limited and used under licence.
About AGF Management Limited
Founded in 1957, AGF Management Limited (AGF) is an independent and globally diverse asset management firm. AGF brings a disciplined approach to delivering excellence in investment management through its fundamental, quantitative, alternative and high-net-worth businesses focused on providing an exceptional client experience. AGF’s suite of investment solutions extends globally to a wide range of clients, from financial advisors and individual investors to institutional investors including pension plans, corporate plans, sovereign wealth funds and endowments and foundations.
For further information, please visit AGF.com.
© 2022 AGF Management Limited. All rights reserved.
This post was first published at the AGF Perspectives Blog.