
by Lance Roberts, RIA
Recession risk is rising rapidly. In fact, it is possible that we may already be in one.
While such a claim may sound impossible, given that Q4-GDP was above 5% in terms of annualized growth, such would not be the first time such a turn occurred.
As I discussed in “Shortest Recession In History,” the 2020 recession lasted just two months. However, during those two months, the economy fell by 31.4% (GDP), and the financial markets plunged by 33%. Both of those declines, as shown in the table below, are within historical norms.
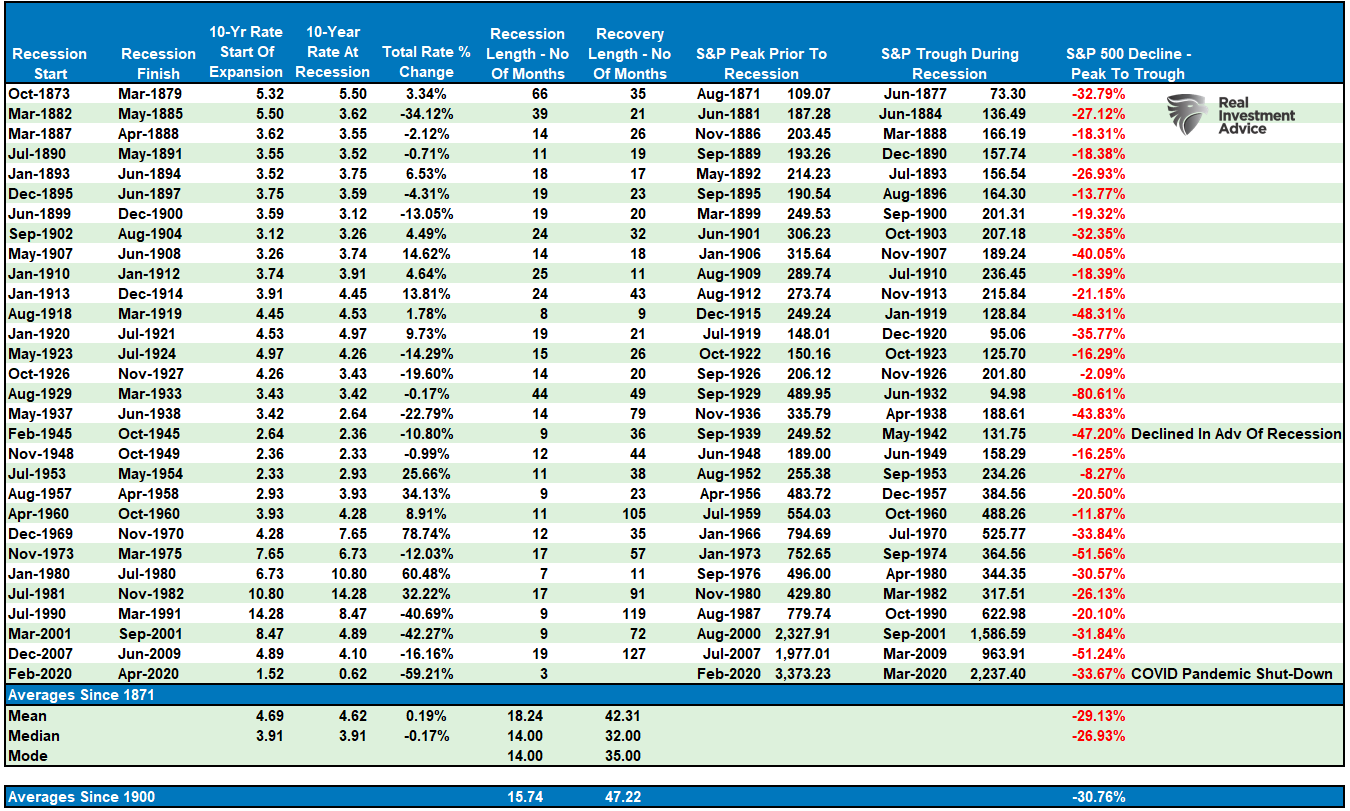
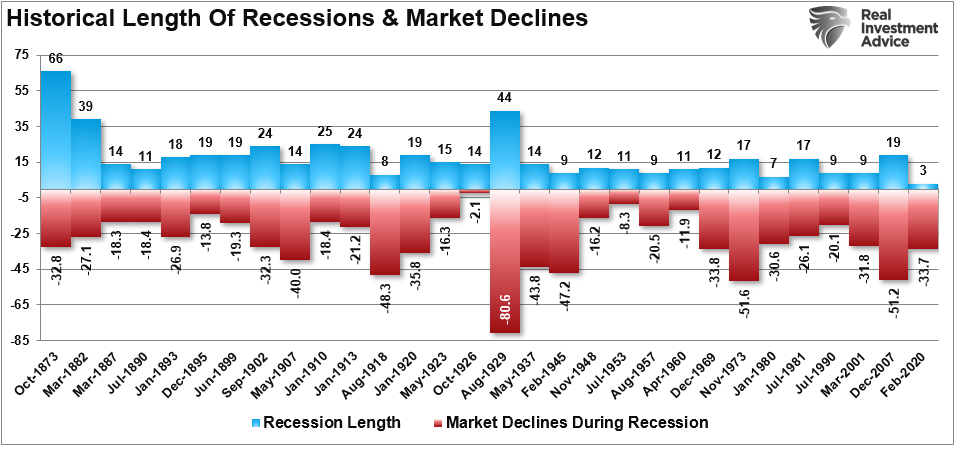
Here it is graphically. The chart shows the historical length of each recession and the corresponding market decline.
However, while the effects of the “recession” were all within historical norms, the recession itself was not. As the National Bureau Of Economic Research stated at that time:
“In determining that a trough occurred in April 2020, the committee DID NOT conclude that the economy has returned to operating at normal capacity. The committee decided that any future downturn of the economy would be a new recession and not a continuation of the recession associated with the February 2020 peak.
The last sentence is the most important.
While the interventions certainly salvaged the economy from a more prolonged recessionary event, they also made the economy more fragile. Furthermore, by dragging forward future consumption, the interventions only gave the appearance of economic activity. As that liquidity reverses, and assuming interventions don’t repeat, the economy will reverse course rapidly. Such is already evident in the Atlanta Fed’s GDP forecast for Q1-2022.

NBER Is Always Late
The current consensus is with strong Q4 economic growth, unemployment near record lows, and nominal wage growth rising, there is “no recession on the horizon.”
Obviously, the recent spasms of the market this year are nothing more than a normal market correction that historically happens. The chart shows the S&P 500 going back to 1960 with some “interesting blue dots.” (Cheap trick to get you to keep reading.)

The problem with making an assessment about the state of the economy today, based on current data points, is that these numbers are only “best guesses.” Economic data is subject to substantive negative revisions as data gets collected and adjusted over the forthcoming 12- and 36-months.
Consider for a minute that in January 2008 Chairman Bernanke stated:
“The Federal Reserve is not currently forecasting a recession.”
In hindsight, the NBER, in December 2008, dated the start of the official recession was December 2007.
If Ben Bernanke didn’t know a recession was underway, how would we?
Let’s take a look at the data below of real (inflation-adjusted) economic growth rates:

Each of the dates above shows the growth rate of the economy immediately prior to the onset of a recession. You will note in the table above that in 7 of the last 10 recessions, real GDP growth was running at 2% or above. In other words, according to the media, there was NO indication of a recession.
But the next month one began.
Let’s go back to those “interesting blue dots” in the S&P 500 chart above.
Each of those dots is the peak of the market PRIOR to the onset of a recession. In 9 of 10 instances, the S&P 500 peaked and turned lower prior to the recognition of a recession.

Waiting On The Data
In other words, the decline from the peak was “just a correction” as economic growth was still strong.
In reality, however, the market was signaling a coming recession in the months ahead. The economic data just didn’t reflect it as of yet. (The only exception was 1980 where they coincided in the same month.) The table below shows the date of the market peak and real GDP versus the start of the recession and GDP growth at that time.
The problem is in waiting for the data to catch up.
Prior to 1980, the NBER did not officially date recession starting and ending points.
For example:
- In July 1956, the market peaked at 48.78 and started to decline.
- Economic growth was increasing from 0.9% and heading to 3.07% in 1957. (No sign of recession)
- In September 1957 the economy fell into recession and the market had already fallen by almost 10%.
- From peak to trough, the market fell 17.38%
- Importantly, the market had warned of a recession 14-months in advance.

As noted above, during the entirety of 2007, the majority of the media, analysts, and economic community proclaimed there was “no sign of recession.”
Today, we are once again seeing many of the same early warnings. If you have been paying attention to the trend of the economic data, the stock market, and the yield curve, the warnings are becoming more pronounced.
So, therein lies THE question:
Is the market currently signaling a “recession warning?”
Everybody wants a specific answer. “Yes” or “No.”
The Yield Curve Warning
Unfortunately, making absolute predictions can be extremely costly when it comes to portfolio management.
Note: In the table above, the time span between the market downturn and the start of a recession has gotten compressed since 1973. This is due to the NBER looking backward and using “revised” data by the BEA. Therefore, the data aligns more closely with what the market signaled PRIOR TO those economic revisions.
There are three lessons to be learned from this analysis:
- The economic “number” reported today will not be the same when it is revised in the future.
- The trend and deviation of the data are far more important than the number itself.
- “Record” highs and lows are records for a reason as they denote historical turning points in the data.
We do know, with absolute certainty, this cycle will end.
“Economic cycles are only sustainable for as long as excesses are built. The natural law of reversions, while they can be suspended by artificial interventions, cannot be repealed.”
As such, the yield curve is one of the most important indicators for determining recession risk and the potential for a subsequent bear market.
Investors should never dismiss the message sent by the bond market. Bonds are essential for their predictive qualities, which is why analysts pay an enormous amount of attention to U.S. government bonds.
Oil prices, war, political uncertainty, the dollar, credit risk, earnings, etc., all get reflected in the level of interest rates. From the time the yield curve inverts, a recession started within roughly 9-months. The declining yield curve suggests economic growth is slowing.

While it may seem as if a recession is “nowhere in sight,” the yield curve suggests that risk is higher than we think.
Recession Risk Higher We Think
“While the NBER declared the 2020 recession the shortest in history, such does not preclude another recession from occurring sooner than later. All the excesses that existed before the last recession have worsened since then.
Given the dynamics for an economic recession remain, it will only require an unexpected, exogenous event to push the economy back into contraction.”
At that time, the Fed didn’t believe that $5 Trillion in liquidity would spark the highest level of inflation since the 1970s. Nor did they expect a geopolitical crisis with Russia. However, the coincident surge of inflation, combined with spiking energy costs, is negatively impacting consumption.
Unfortunately, it isn’t just inflation that is the problem. The surge of liquidity in 2020 pulled forward a massive amount of consumer spending. With that liquidity now gone, and wages not keeping up with inflation, consumption (70% of the GDP calculation) will slow sharply in the months ahead.
Coincidently, the Federal Reserve is getting forced to hike rates to combat those inflationary pressures. Those higher rates reduce inflation by slowing economic growth.
As noted in “The Fed Won’t Hike As Much As Expected:”
“While raising rates will increase recession risk and a significant market correction, it might be the ‘lesser of two evils from the Fed’s perspective.
Being caught near the ‘zero bound’ at the onset of a recession leaves few options to stabilize an economic decline.”
There are many factors that could keep the economy from slipping into a recession. However, recession risk is clearly elevated and the market may be a warning of the same. Historically, spiking inflation is coincident with market peaks and bear markets.

If you are quick to dismiss the idea, remember no one expected a recession in 2020 either.
But we did warn you about it in 2019.