by Don Vialoux, EquityClock.com
The Bottom Line
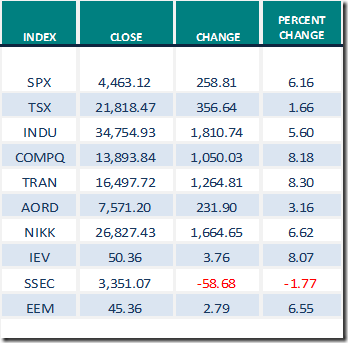
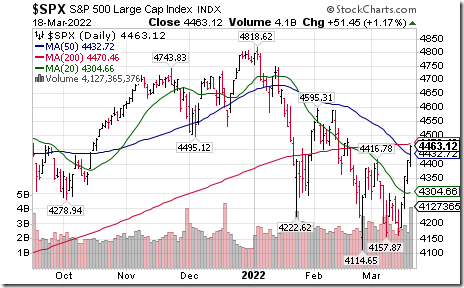
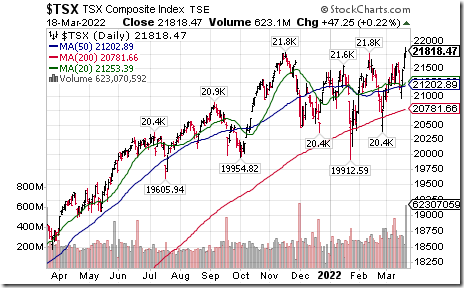
World equity indices reached an important inflection point last week. They are following their historic seasonal path: recovering from mid-March to at least early May and frequently into late July. Notable was strength by the TSX Composite Index with a gain to an all-time high on Friday.
Observations
Consensus earnings estimates for S&P 500 companies on a year-over-year basis in the first quarter of 2022 were unchanged last week: 66 companies have issued negative guidance to date and 29 companies have issued positive guidance. According to www.FactSet.com first quarter earnings on a year-over-year basis are expected to increase 4.8% and revenues are expected to increase 10.7%.
Consensus estimates for S&P 500 companies beyond the first quarter on a year-over-year basis increased slightly. According to www.FactSet.com second quarter earnings are expected to increase 5.4% (versus 5.2% last week) and revenues are expected to increase 9.7% (versus 9.5% last week). Earnings on a year-over-year basis for all of 2022 are expected to increase 9.3% (versus 9.1% last week) and revenues are expected to increase 9.0% (versus 8.9% last week).
Economic News This Week
February U.S. New Home Sales to be released at 10:00 AM EDT on Wednesday are expected to increase 810, 000 units from 801,000 units in January.
February Durable Goods Orders to be released at 8:30 AM EDT on Thursday are expected to drop 0.6% versus a gain of 1.6% in January.
March Michigan Consumer Sentiment to be released at 10:00 AM EDT on Friday is expected to be unchanged from February at 59.7.
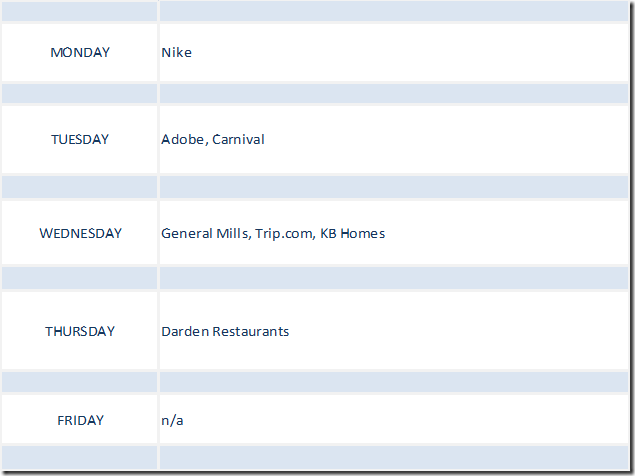
Selected Earnings News This Week
Trader’s Corner
Equity Indices and Related ETFs
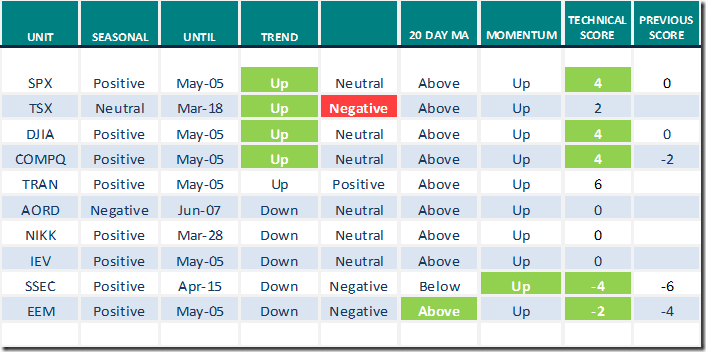
Daily Seasonal/Technical Equity Trends for March 18th 2022
Green: Increase from previous day
Red: Decrease from previous day
Commodities
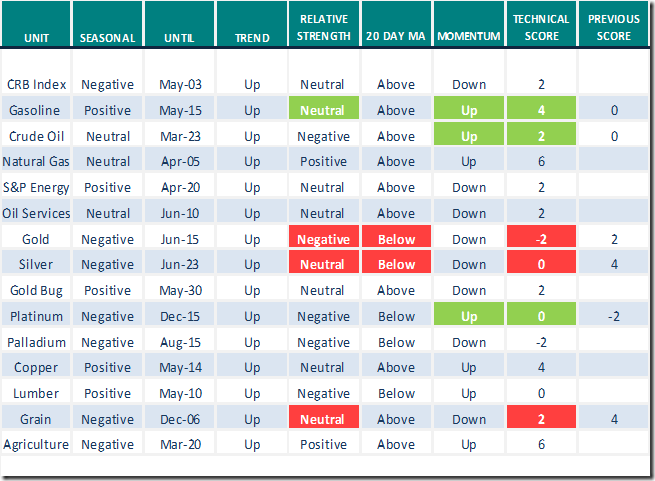
Daily Seasonal/Technical Commodities Trends for March 18th 2022
Green: Increase from previous day
Red: Decrease from previous day
Sectors
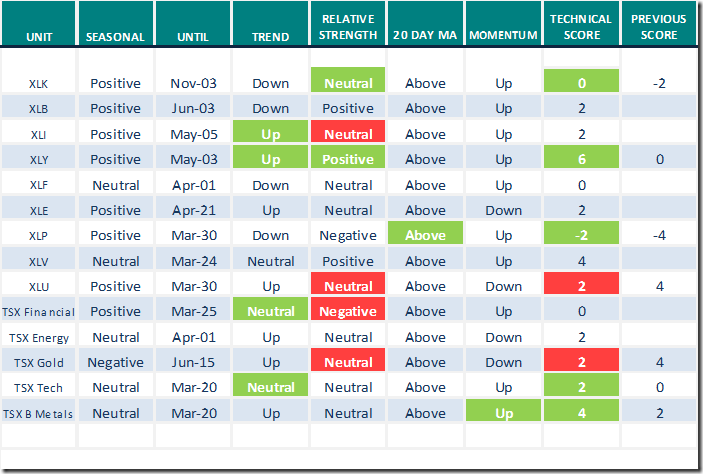
Daily Seasonal/Technical Sector Trends for March 18th 2021
Green: Increase from previous day
Red: Decrease from previous day
All seasonality ratings are based on performance relative to the S&P 500 Index (except TSX)
Links offered by valued providers
Mark Leibovit’s weekly comment
Nickel, Lithium, Gold, Silver, Copper – HoweStreet
New Bullish Uptrend in the Market | Mary Ellen McGonagle
https://www.youtube.com/watch?v=0ZCcZIdnMF0
Greg Schnell discusses “The rally ahead”.
The Rally Ahead | ChartWatchers | StockCharts.com
Erin Swenlin from StockCharts.com notes that “Healthcare triggers an IT Trend Model silver cross buy signal”
Michael Campbell’s Weekly Money Talks for March 19th
March 19th Episode (mikesmoneytalks.ca)
Links from Mark Bunting and www.uncommoninvestor.com
These Two Charts May Be the Most Important in the World Right Now – Uncommon Sense Investor
"Putin’s Already Lost" – Uncommon Sense Investor
Weekly Technical Scoop from David Chapman and www.EnrichedInvesting.com
To be added.
Technical Scores
Calculated as follows:
Intermediate Uptrend based on at least 20 trading days: Score 2
(Higher highs and higher lows)
Intermediate Neutral trend: Score 0
(Not up or down)
Intermediate Downtrend: Score -2
(Lower highs and lower lows)
Outperformance relative to the S&P 500 Index: Score: 2
Neutral Performance relative to the S&P 500 Index: 0
Underperformance relative to the S&P 500 Index: Score –2
Above 20 day moving average: Score 1
At 20 day moving average: Score: 0
Below 20 day moving average: –1
Up trending momentum indicators (Daily Stochastics, RSI and MACD): 1
Mixed momentum indicators: 0
Down trending momentum indicators: –1
Technical scores range from -6 to +6. Technical buy signals based on the above guidelines start when a security advances to at least 0.0, but preferably 2.0 or higher. Technical sell/short signals start when a security descends to 0, but preferably -2.0 or lower.
Long positions require maintaining a technical score of -2.0 or higher. Conversely, a short position requires maintaining a technical score of +2.0 or lower
Changes Last Week
Technical Notes released on Friday at
S&P 500 Index moved above $4157.78 and its related ETF $SPY moved above $439.74 completing short term double bottom patterns.
TSX Composite Index $TSX.CA moved above its November high at 21,796.16 to an all-time high extending an intermediate uptrend.
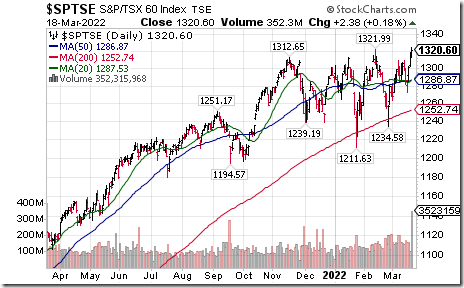
S&P TSX 60 Index $SPTSE moved above $1,321.99 to an all-time high extending an intermediate uptrend.
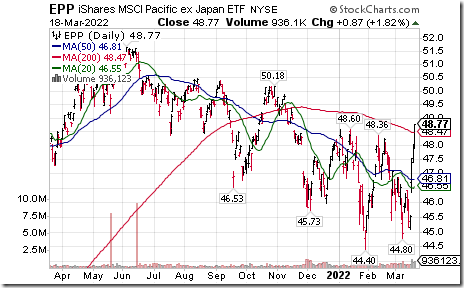
Pacific ex Japan iShares $EPP moved above $44.60 completing a double bottom pattern.
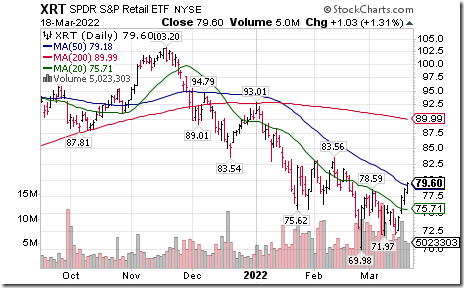
Retail SPDRs $XRT moved above $78.59 completing a double bottom pattern. Seasonal influences are favourable to April 6th. If a subscriber to EquityClock, see seasonality chart at charts.equityclock.com/spdr…
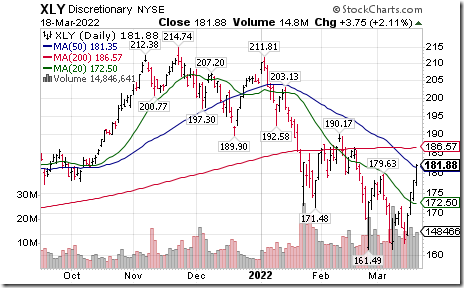
Consumer Discretionary SPDRs $XLY moved above $179.63 completing a double bottom pattern.
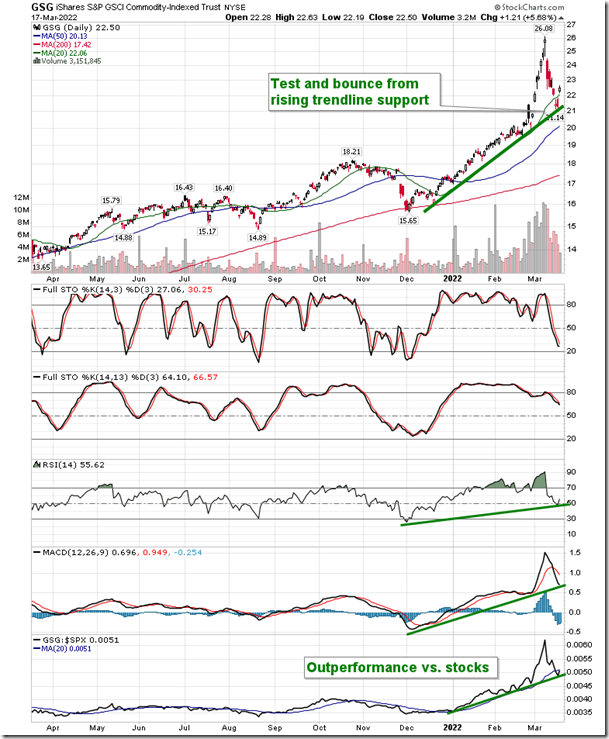
Commodities bouncing from rising trendline support, warranting a re-look at exposure to this asset class. equityclock.com/2022/03/17/… $GSG $DBC $USO $OIL
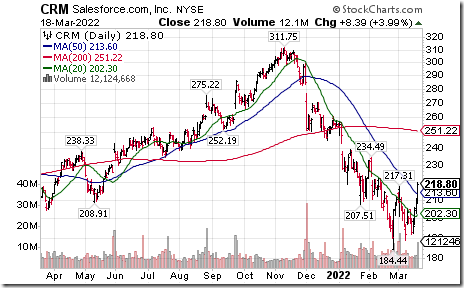
Salesforce $CRM a Dow Jones Industrial Average stock moved above $217.31 completing a double bottom pattern.
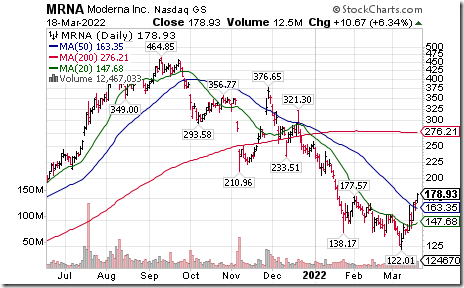
Moderna $MRNA a NASDAQ 100 stock moved above intermediate resistance at $177.57
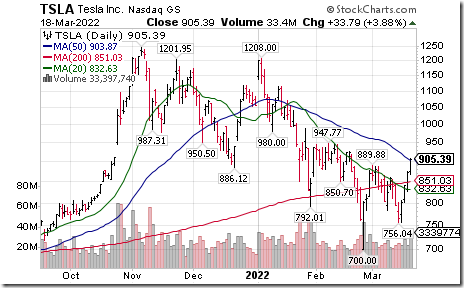
Tesla $TSLA a NASDAQ 100 stock moved above $889.88 completing a double bottom pattern.
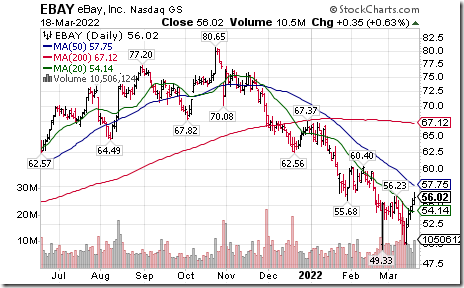
eBay $EBAY a NASDAQ 100 stock moved above $56.23 completing a double bottom pattern.
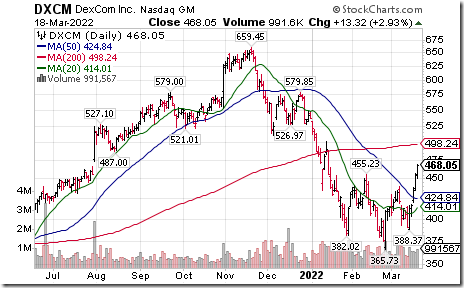
DexCom $DXCM a NASDAQ 100 stock moved above $455.23 completing a reverse Head & Shoulders pattern
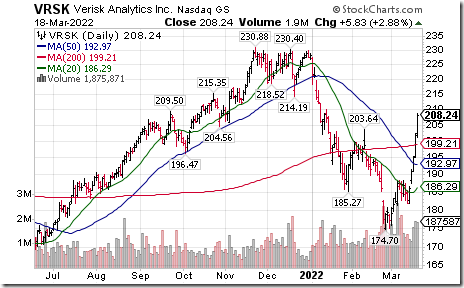
Verisk $VRSK a NASDAQ 100 stock moved above intermediate resistance at $203.62
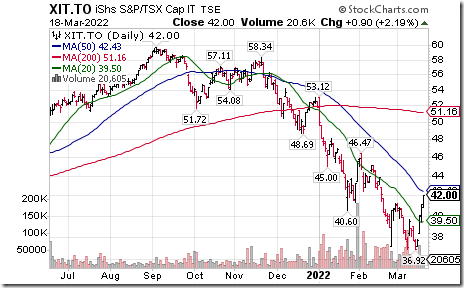
Cdn. Technology iShares $XIT.CA moved above Cdn$41.25 completing a double bottom pattern.
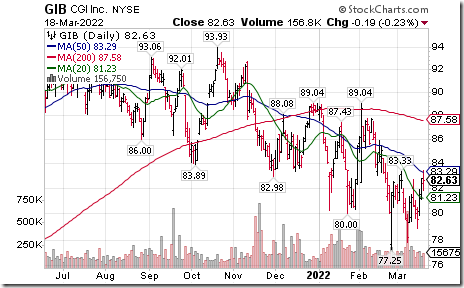
CGI Group $GIB a TSX 60 stock moved above US$83.33 completing a double bottom pattern. Seasonal influences are favourable until at least early June. If a subscriber to EquityClock, see seasonality chart at https://charts.equityclock.com/cgi-group-inc-nysegib-seasonal-chart
S&P 500 Momentum Barometers
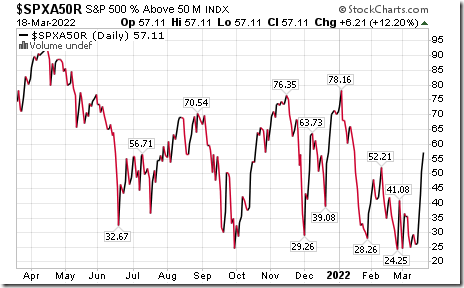
The intermediate term Barometer added 6.21 on Friday and 30.86 last week to 57.11. It changed from Oversold to Neutral on a move above 40.00. Trend is up.
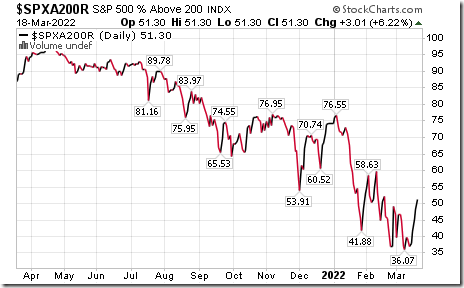
The long term Barometer added 3.01 on Friday and 14.23 last week to 51.30. It changed from Oversold to Neutral. Trend is up.
TSX Momentum Barometers
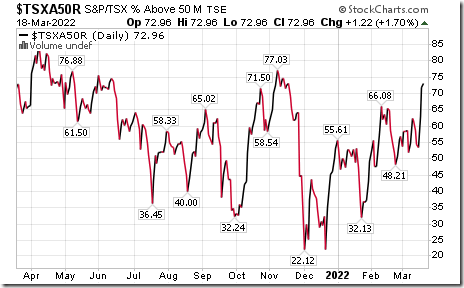
The intermediate term Barometer added 1.22 on Friday and 14.19 last week to 72.96. It changed from Neutral to Overbought on a move above 60.00. Trend is up.
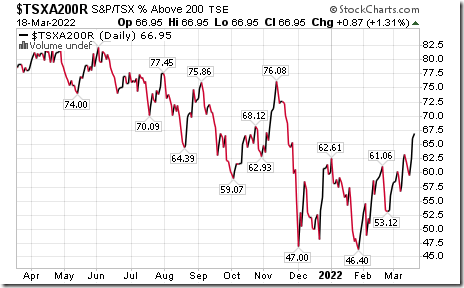
The long term Barometer added 0.87 on Friday and 5.11 last week to 66.95. It remains Overbought. Trend is up.
Disclaimer: Seasonality and technical ratings offered in this report and at
www.equityclock.com are for information only. They should not be considered as advice to purchase or to sell mentioned securities. Data offered in this report is believed to be accurate, but is not guaranteed.
This post was originally publised at Vialoux's Tech Talk.


