by Don Vialoux, EquityClock.com
Technical Notes released yesterday at
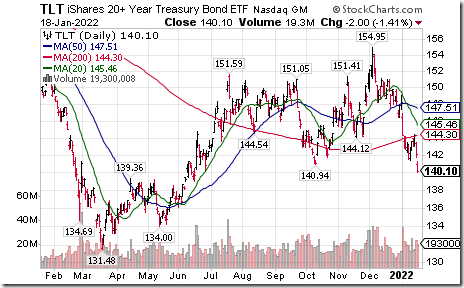
Long term Treasury iShares $TLT move below intermediate support at $140.94
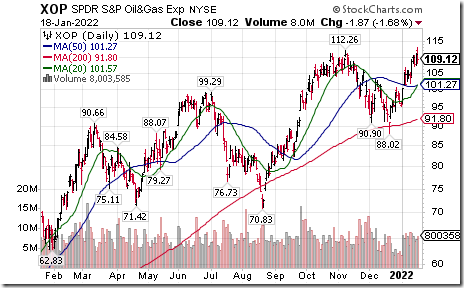
Oil and Gas Exploration SPDRs $XOP moved above $112.26 extending an intermediate uptrend.
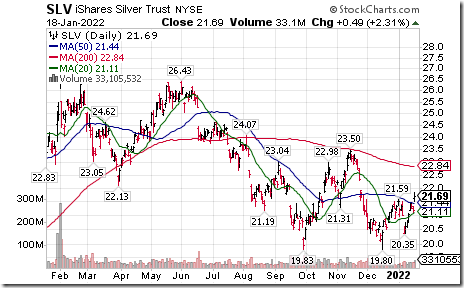
Silver iShares $SLV moved above US$21.59 setting an intermediate uptrend. Seasonal influences are favourable to the end of February. If a subscriber to EquityClock, see seasonality chart at https://charts.equityclock.com/ishares-silver-trust-nyseslv-seasonal-chart
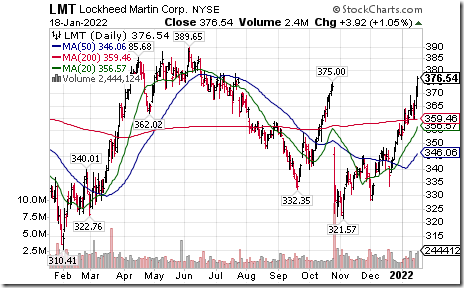
Lockheed Martin $LMT an S&P 100 stock moved above $375.00 extending an intermediate uptrend. Seasonal influences are favourable until at least late February and frequently until summer. If a subscriber to EquityClock, see seasonality chart at https://charts.equityclock.com/lockheed-martin-corporation-nyselmt-seasonal-chart
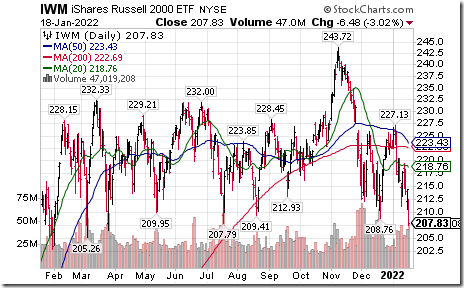
Russell 2000 iShares $IWM moved below $208.76 extending an intermediate downtrend.
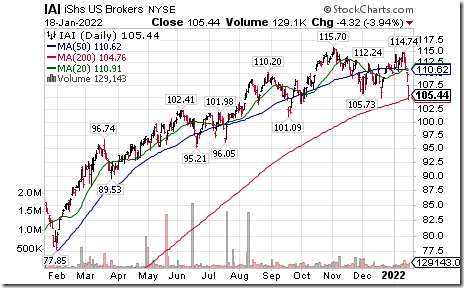
U.S. Broker iShares $IAI moved below $107.73 completing a double top pattern.
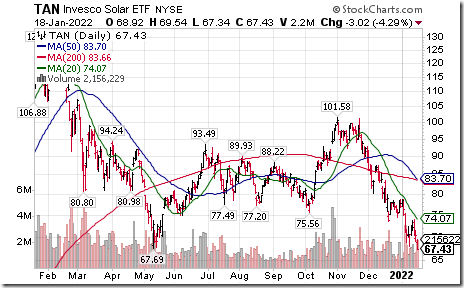
Solar ETF $TAN moved below $67.69 extending an intermediate downtrend.
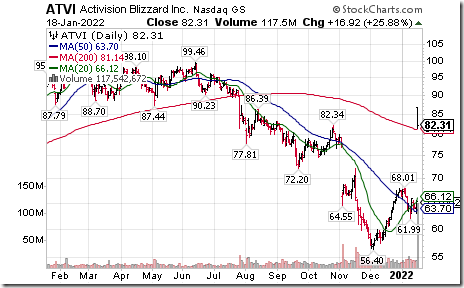
Activision $ATVI a NASDAQ 100 stock moved above $68.01 and $83.34 following receipt of a takeover offer by Microsoft at $95 per share. Value of the offer is estimated at $68.7 billion.
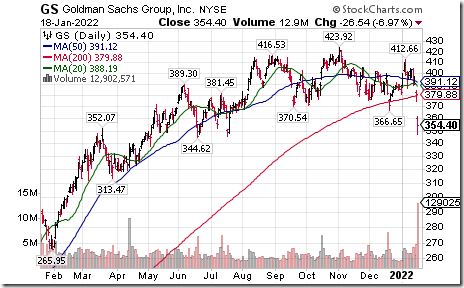
Goldman Sachs $GS a Dow Jones Industrial Average stock moved below $366.65 completing a Head & Shoulders pattern.
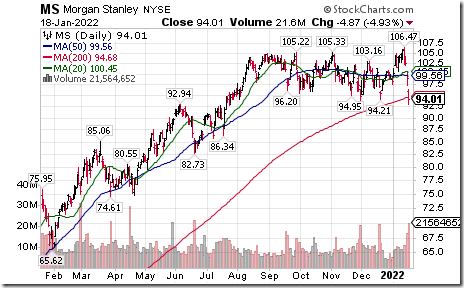
Morgan Stanley $MS an S&P 100 stock moved below $94.21 completing a double top pattern.
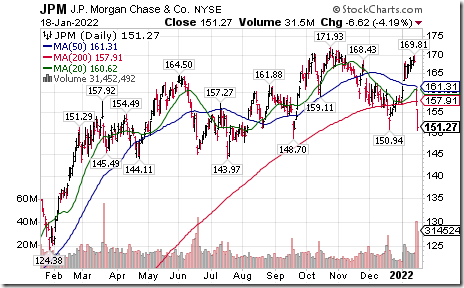
JP Morgan $JPM a Dow Jones Industrial Average stock moved below $150.94 completing a double top pattern.
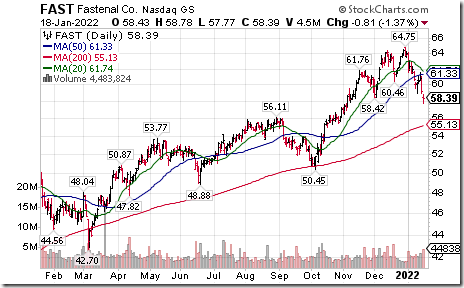
Fastenal $FAST a NASDAQ 100 stock moved below $58.42 completing an intermediate topping pattern.
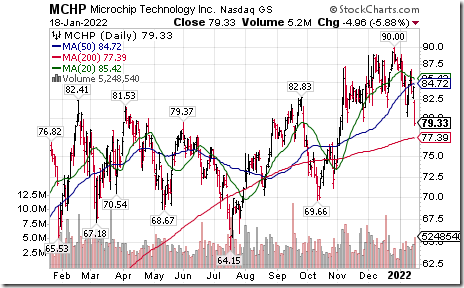
Microchip Technologies $MCHP a NASDAQ 100 stock moved below $79.53 setting an intermediate downtrend.
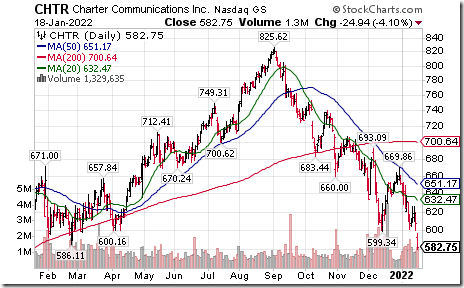
Charter Communications $CHTR a NASDAQ 100 stock moved below $599.34 extending an intermediate downtrend.
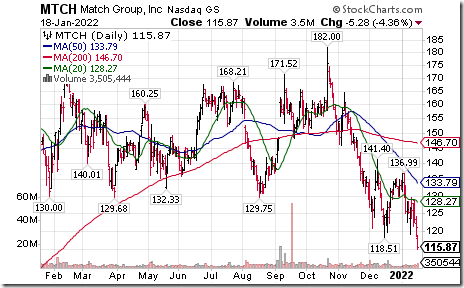
Match Group $MTCH a NASDAQ 100 stock moved below $118.51 extending an intermediate downtrend.
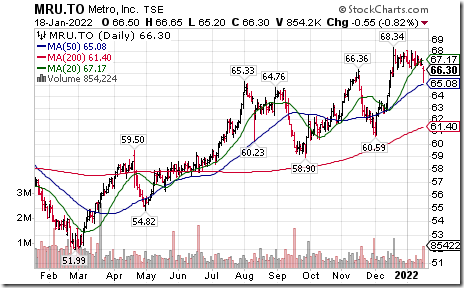
Metro $MRU.CA a TSX 60 stock moved below $66.40 completing a double top pattern.
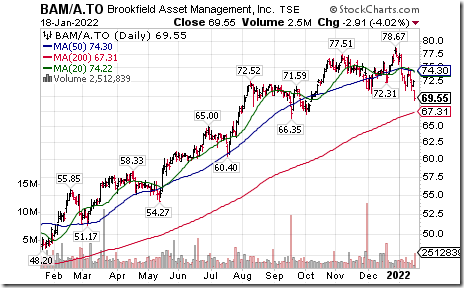
Brookfield Asset Management $BAM.A.CA a TSX 60 stock moved below intermediate support at Cdn$70.43
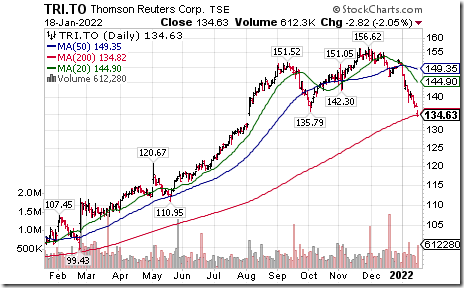
Thomson Reuters $TRI.CA a TSX 60 stock moved below intermediate support at Cdn$135.79
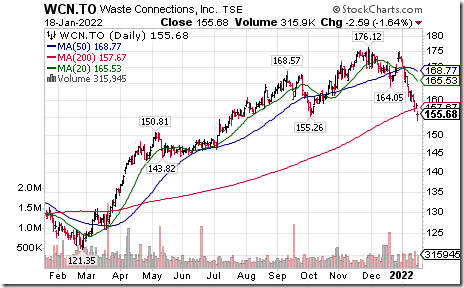
Waste Connection $WCN.CA a TSX 60 stock moved below Cdn$155.26 extending an intermediate downtrend.
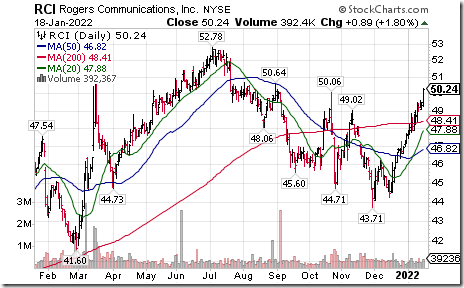
Rogers Communications $RCI a TSX 60 stock moved above intermediate resistance at US$50.64 extending an intermediate uptrend.
Trader’s Corner
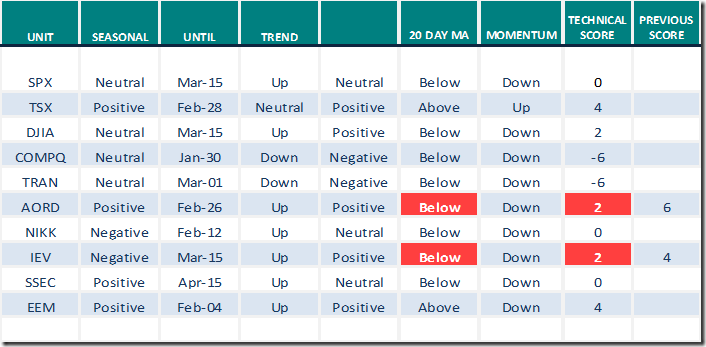
Equity Indices and Related ETFs
Daily Seasonal/Technical Equity Trends for Jan.18th 2022
Green: Increase from previous day
Red: Decrease from previous day
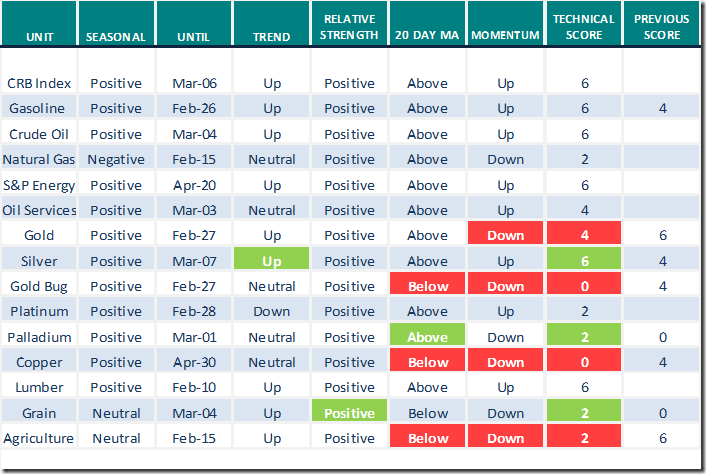
Commodities
Daily Seasonal/Technical Commodities Trends for Jan.18th 2022
Green: Increase from previous day
Red: Decrease from previous day
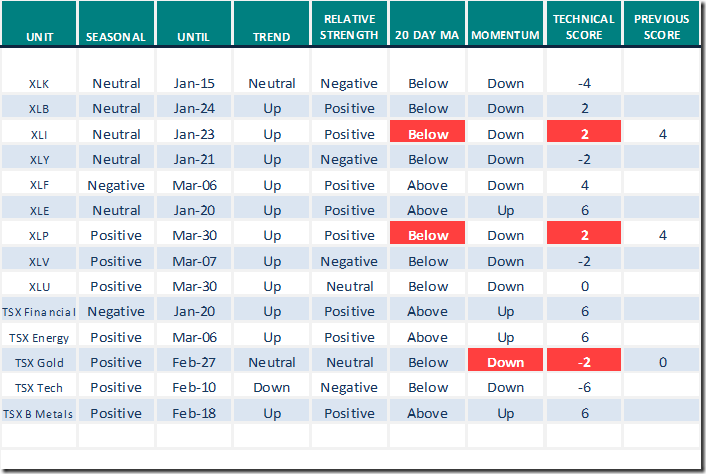
Sectors
Daily Seasonal/Technical Sector Trends for Jan.18th 2021
Green: Increase from previous day
Red: Decrease from previous day
All seasonality ratings are based on performance relative to the S&P 500 Index (except TSX)
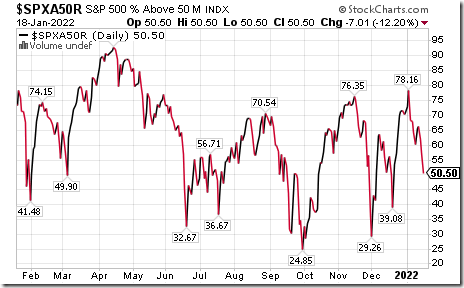
S&P 500 Momentum Barometers
The intermediate term Barometer dropped 7.01 to 50.50 yesterday. It remains Neutral and trending down.
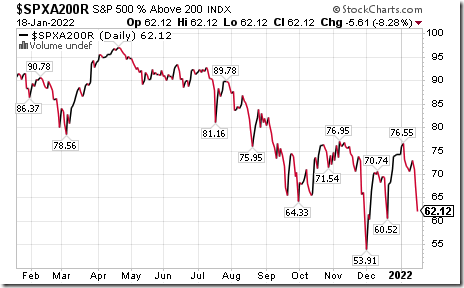
The long term Barometer fell 5.61 to 62.12 yesterday It remains Overbought and trending down.
TSX Momentum Barometers
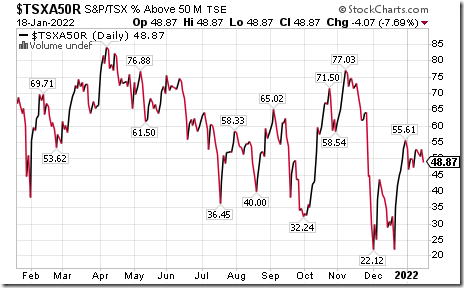
The intermediate term Barometer slipped 4.07 to 48.87 yesterday. It remains Neutral.
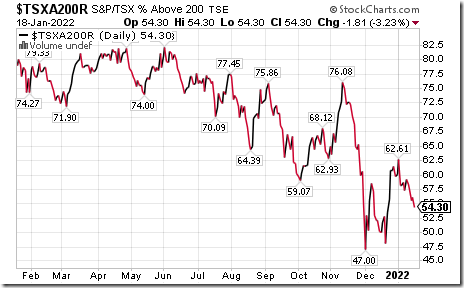
The long term Barometer slipped 1.81 to 54.30 yesterday. It remains Neutral and trending down.
Disclaimer: Seasonality and technical ratings offered in this report and at
www.equityclock.com are for information only. They should not be considered as advice to purchase or to sell mentioned securities. Data offered in this report is believed to be accurate, but is not guaranteed
This post was originally publised at Vialoux's Tech Talk.


