by Don Vialoux, EquityClock.com
Observation
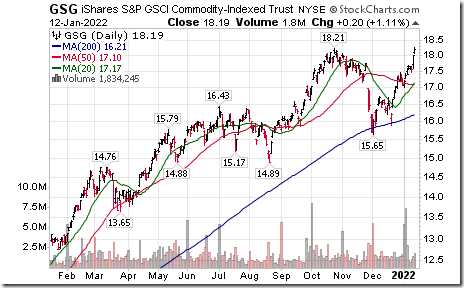
The industrial commodity ETF (Symbol: GSG) moved above $18.21 to a four year high. Also, the CRB Index moved above 241.18 to a seven year high. Notable was strength in base metal and energy commodity prices.
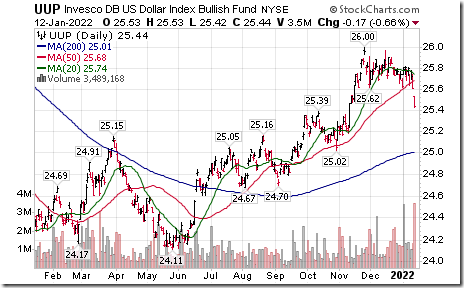
Industrial commodity prices are responding to completion of a double top pattern by the U.S. Dollar Index and its related ETF (Symbol:UUP)
Technical Notes released yesterday at
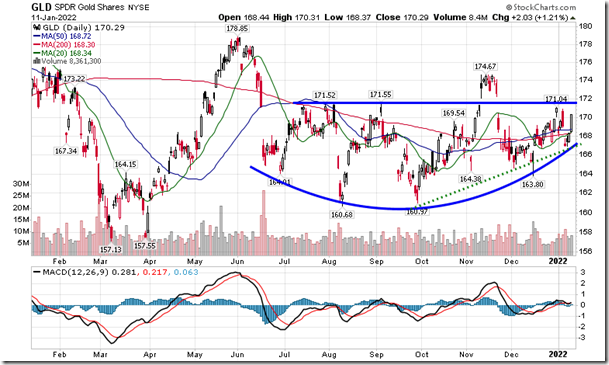
The case for Gold and the fundamental headwinds against it in 2022. equityclock.com/2022/01/11/… $GLD $SGOL $GDX $GDXJ $NUGT $JNUG $DUST $JDST #Gold
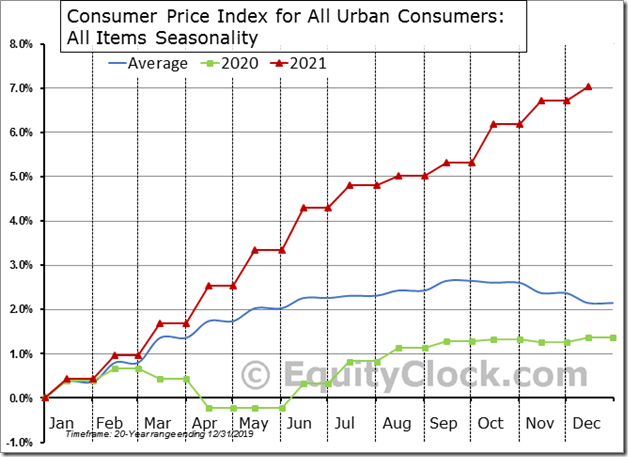
US Consumer Price Index (CPI) was higher by 7.0% in 2021, which is the strongest calendar-year pace since 1981 and well above the 2.1% increase that has been average over the past two decades. $STUDY $MACRO #CPI $TIP
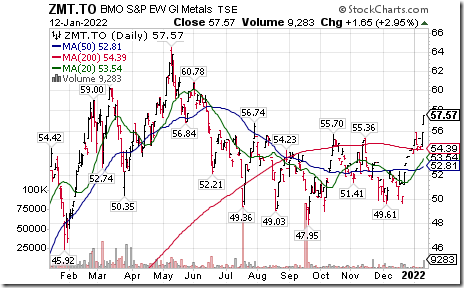
BMO Equal Weight Base Metals ETF $ZMT.CA moved above $55.70 and $56.74 extending an intermediate uptrend. Seasonal influences are favourable to late February. If a subscriber to EquityClock, see seasonality chart at https://charts.equityclock.com/bmo-sptsx-equal-weight-global-base-metals-hedged-to-cad-index-etf-tsezmt-to-seasonal-chart
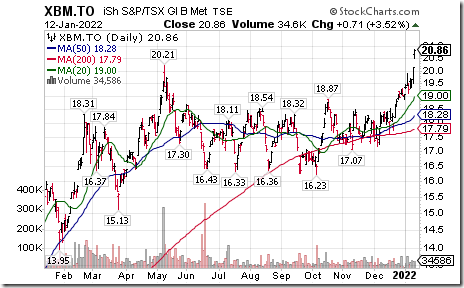
Base Metals iShares $XBM.CA moved above Cdn$20.21 to an all-time high extending an intermediate uptrend. Seasonal influences are favourable to late February. If a subscriber to EquityClock, see seasonality chart at https://charts.equityclock.com/ishares-sptsx-global-base-metals-index-etf-tsexbm-to-seasonal-chart
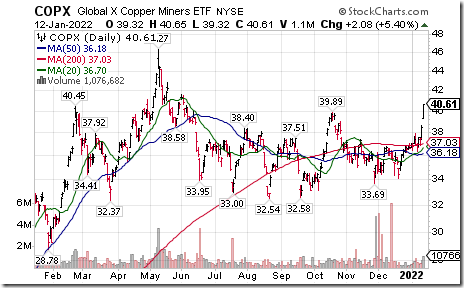
Copper Miners ETF $COPX moved above $39.97 extending an intermediate uptrend. Seasonal influences are favourable until at least late February. If a subscriber to EquityClock, see seasonality chart at https://charts.equityclock.com/global-x-copper-miners-etf-nysecopx-seasonal-chart
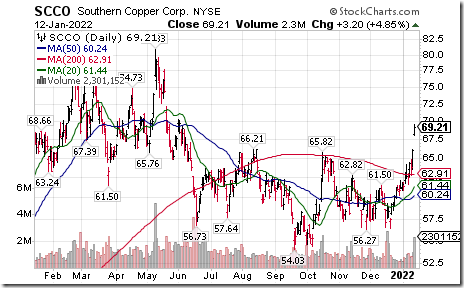
Southern Copper $SCCO one of the world’s largest copper producers moved above $6582 and $66.21 extending an intermediate uptrend. Seasonal influences are favourable to late April. If a subscriber to EquityClock, see seasonality chart at https://charts.equityclock.com/southern-copper-corp-nysescco-seasonal-chart
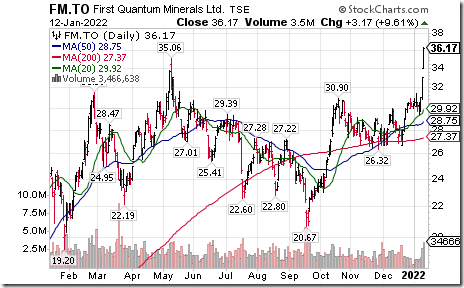
First Quantum $FM.CA a TSX 60 stock moved above $35.06 to an all-time high extending an intermediate uptrend. Seasonal influences are favourable to the end of April. If a subscriber to EquityClock, see seasonality chart at https://charts.equityclock.com/first-quantum-minerals-ltd-otcmktfqvlf-seasonal-chart
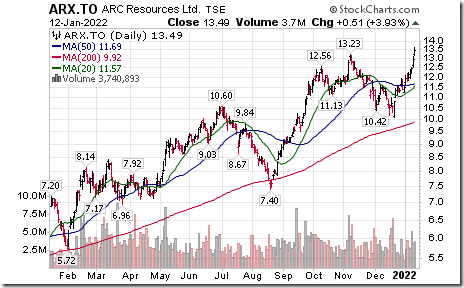
Canadian "gassy" stocks are responding to colder than average weather and higher natural gas prices. ARC Resources $ARX.CA moved above $13.23 extending an intermediate uptrend. Seasonal influences are favourable until at least the end of February and frequently to May. If a subscriber to EquityClock, see seasonality chart at https://charts.equityclock.com/arc-resources-ltd-tsearx-seasonal-chart
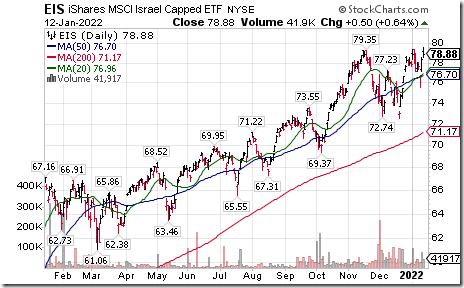
Israel iShares $EIS moved above $79.35 to an all-time high extending an intermediate uptrend. Seasonal influences are favourable to mid-April. If a subscriber to EquityClock, see seasonality chart at https://charts.equityclock.com/ishares-msci-israel-capped-etf-nyseeis-seasonal-chart
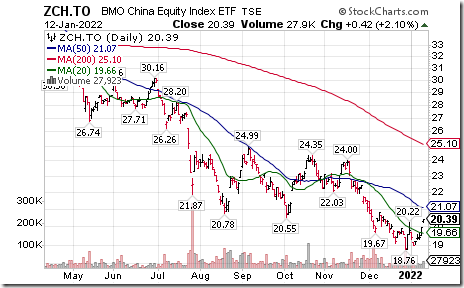
BMO China ETF $ZCH.CA moved above $20.20 completing a reverse Head & Shoulders pattern. Seasonal influences are strongly favourable to the end of February and frequently to the end of April. If a a subscriber to EqutyClock, see seasonality chart at https://charts.equityclock.com/bmo-china-equity-index-etf-tsezch-to-seasonal-chart
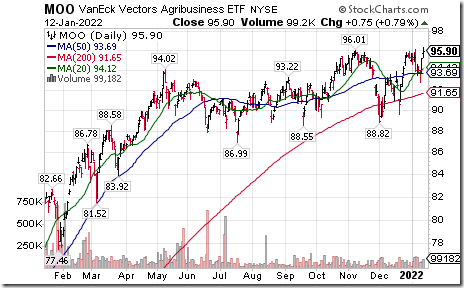
Agriculture ETF $MOO moved above $96.01 to an all-time high extending an intermediate uptrend.
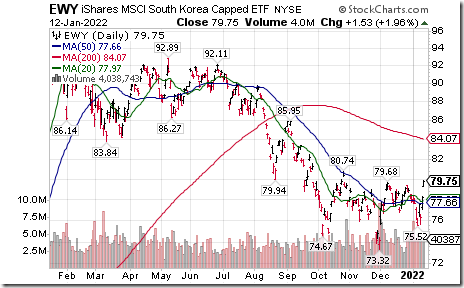
South Korea iShares $EWY moved above $79.68 completing a reverse Head & Shoulders pattern.
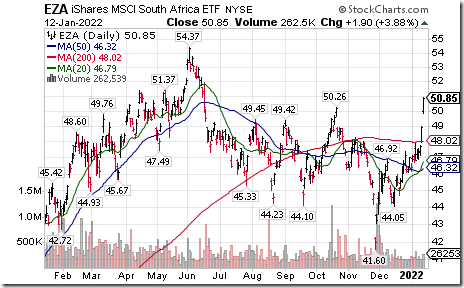
South Africa iShares $EZA moved above $50.26 extending an intermediate uptrend
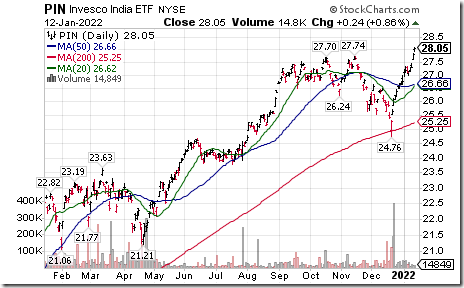
India ETF $PIN moved above $27.74 to an all-time high extending an intermediate uptrend.
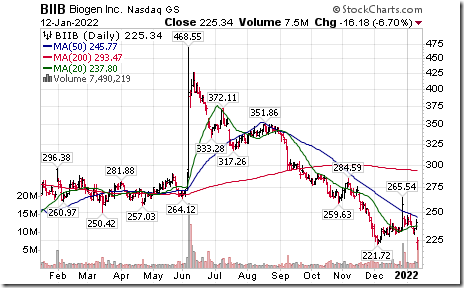
Biogen $BIIB an S&P 100 stock moved below $221.72 extending an intermediate downtrend
Trader’s Corner
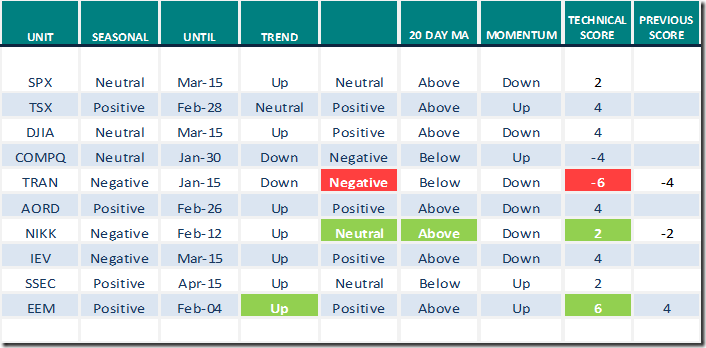
Equity Indices and Related ETFs
Daily Seasonal/Technical Equity Trends for Jan.12th 2022
Green: Increase from previous day
Red: Decrease from previous day
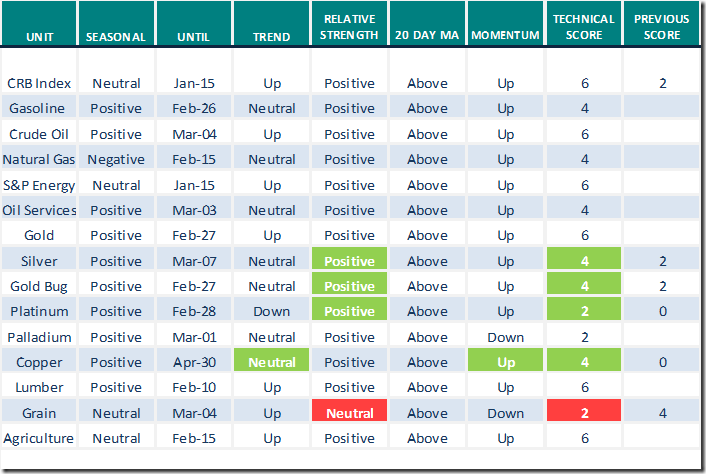
Commodities
Daily Seasonal/Technical Commodities Trends for Jan.12th 2022
Green: Increase from previous day
Red: Decrease from previous day
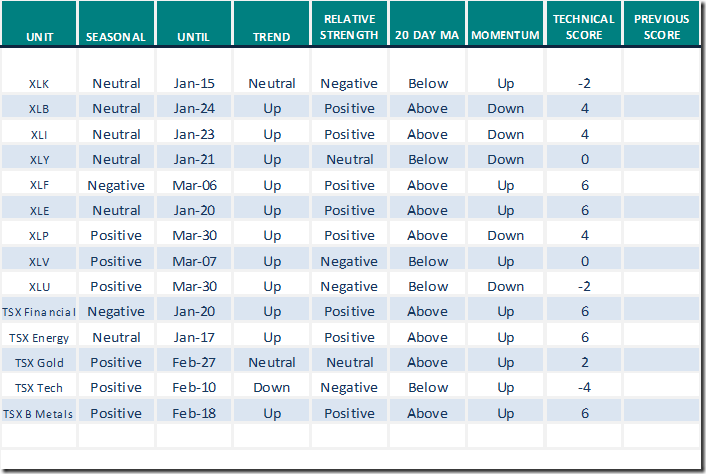
Sectors
Daily Seasonal/Technical Sector Trends for Jan.12th 2021
Green: Increase from previous day
Red: Decrease from previous day
All seasonality ratings are based on performance relative to the S&P 500 Index (except TSX)
Links from Valued Providers
Comments from Mark Bunting and www.uncommonsenseinvestor.com
Top "Special Situations" Amazon Partner Could Gain 59% – Uncommon Sense Investor
Outperforming Value Investor Says Uber is Cheap & Could Double. Seriously. – Uncommon Sense Investor
Could the Nifty Five Go the Way of the Nifty 50? – Uncommon Sense Investor
Greg Schnell’s Market Buzz:
Popping copper in 2022
https://www.youtube.com/watch?v=W3QLeoC2h2s
Seasonality Chart of the Day from www.EquityClock.com
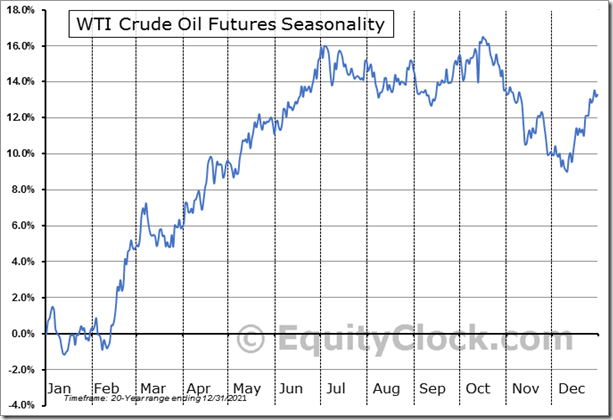
‘Tis the season for WTI crude oil prices to move higher on a real and relative basis from mid-December to June.
Crude Oil Futures (CL) Seasonal Chart
|
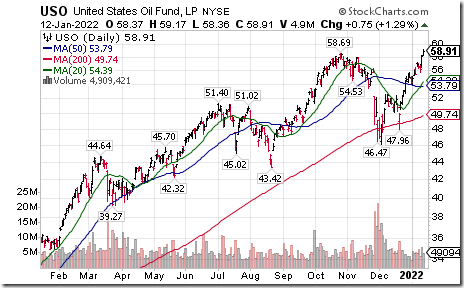
Crude Oil ETN $USO moved above $58.69 extending an intermediate uptrend. Units are closely following their period of seasonal strength from mid-December to June. |
S&P 500 Momentum Barometers
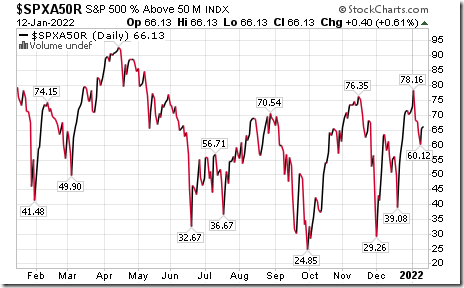
The intermediate term Barometer added 0.40 to 66.13 yesterday. It remains Overbought.
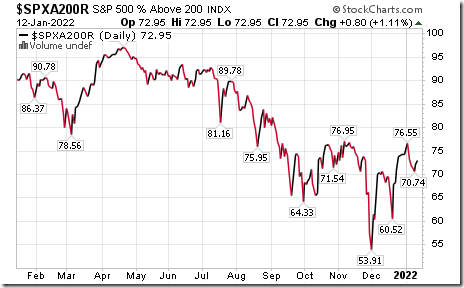
The long term Barometer gained 0.80 to 72.95 yesterday. It remains Overbought.
TSX Momentum Barometers
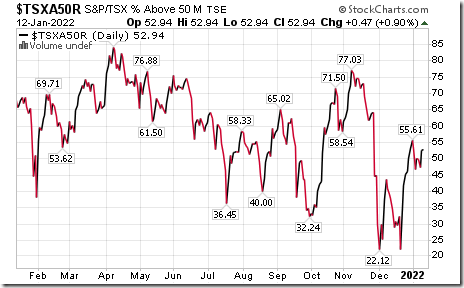
The intermediate Barometer added 0.47 to 52.94 yesterday. It remains Neutral.
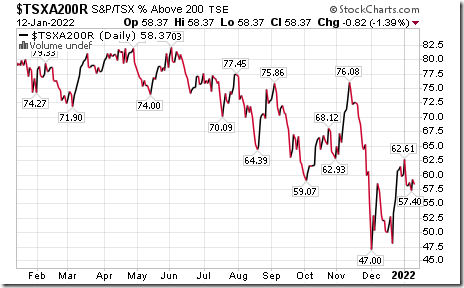
The long term Barometer slipped 0.82 to 58.37 yesterday. It remains Neutral.
Disclaimer: Seasonality and technical ratings offered in this report and at
www.equityclock.com are for information only. They should not be considered as advice to purchase or to sell mentioned securities. Data offered in this report is believed to be accurate, but is not guaranteed
This post was originally publised at Vialoux's Tech Talk.


